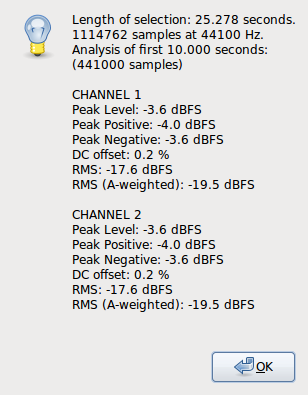
You can use these for SPL measurement by correlating the dBFS with a test tone of known SPL, but I’m mostly interested in this for measuring the noise floors of ADCs. I just posted in that thread because it was related.
that we both get at low, and particularly at high frequencies compared with the on-line calculator:
As I understand, A-weighting is undefined at frequencies higher than 10 kHz, so it’s ambiguous at high and low frequencies. Hopefully it doesn’t have a huge effect on your measurement. I’m going to make a spreadsheet comparing the different filters I’ve seen (Edgar’s, the Matlab bilinear version that I used in my Python script, diracdelta.co.uk, and the filter used in Audio Precision products).
I’ve been considering trying a multi-band “graphic” equalizer instead of the nested lp/hp filters. An FFT filter would probably be the best solution, but that’s a bit beyond my programming abilities at the moment.
I think these would both be worse, actually, especially at low and high frequencies. I previously used the FFT filter in Audition and it didn’t give correct results at low levels, which is why I made the Python script.
Would it suit your purposes better to output a series of rolling average values as labels, or as a text file, rather than just one average RMS/RMS(A) value?
Well, one of the other things I wanted to implement was a maximum and minimum RMS level, like Audition does. In other words, do a sliding window of RMS measurements across the waveform, and find the highest 50 ms and lowest 50 ms, for instance. For something constant like a sine or white noise, the minimum RMS and maximum RMS will be the same. For music, it will find the quietest and loudest parts.
I have a list of other measurements I might implement here: http://github.com/endolith/waveform-analyzer/blob/master/readme.txt
I notice that we have both normalised so that 0 dB RMS reads as 0 dB RMS(A) at 1000 Hz.
I believe this is what the standards all do. My Audio Precision normalizes here, as well.
Which is more useful - a single measurement for the entire selection, or a series of measurements along the time line > (which could be output as labels)?
Both are useful in different contexts.  For me, I just want a single measurement of the entire selection, because my entire selection is usually a constant noise or test tone.
Are A-weighted measurements always RMS?
Yes, A-weighting is inherently related to subjective loudness, and loudness correlates with the energy, or RMS value.
The instantaneous peak value is not related to audibility. It’s just the amount of headroom you have to boost something before it clips. That’s why I’m not sure if the peak value should be before or after removing DC.
How useful would other weightings be?
For example C-weighting follows human hearing at mid to loud levels much more closely than A-weighting.
C-weighting is basically “flat”, so it should be very similar to the unweighted measurement, unless you have a lot of infrasound or ultrasound.
The more I’ve read about A-weighting, the less I like it.
Keep in mind the Wikipedia articles on the subject are written mostly by a guy with an axe to grind. In the real world, I always see A-weighted measurements, both for consumer products and for electronic components. So you need it if you want to do an apples-to-apples comparison between competing products. I was going to try to implement the ITU-R 468 curve anyway, though.