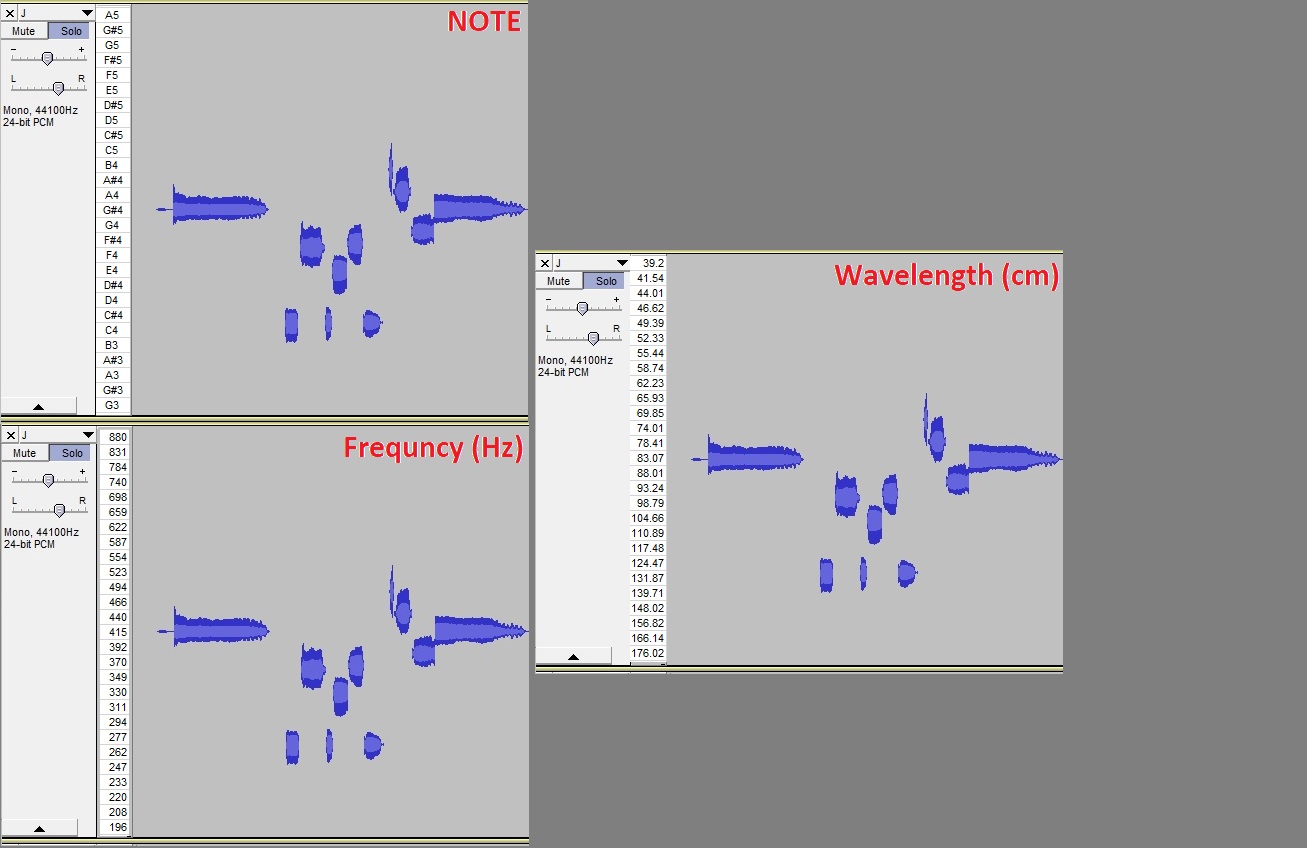
Is there a plugin that can display tracks by pitch … Note (A#3) and/or Frequency (Hz) and/or Wavelength (cm) … instead of by volume?
Is there a plugin that can display tracks by pitch … Note (A#3) and/or Frequency (Hz) and/or Wavelength (cm) … instead of by volume?
As you may know, real world sounds contain many simultaneous frequencies. The perceived “note” or “pitch” is associated with the lowest (fundamental) frequency or the lowest “strong” frequency.
[u]Plot Spectrum[/u] will show amplitude vs frequency for a relatively short selection.
The [u]Spectrogram View[/u] shows a “3-diminesonal” view of frequency vs time with intensity of the frequencies shown by color.
The “EAC” spectrogram algorithm shows the fundamental frequencies.
I’m guessing that you were inspired by the (very expensive) Melodyne software (Celemony | Tomorrow's audio today)
The graphics generated in Melodyn software is not the actual frequency content of the sound, but is a heavily processed analysis of the sound. This type of analysis / processing is very difficult to accomplish, hence the high price tag of their software. I’m not aware of any free software that can do this.
What Audacity can show you, is the actual frequency content of the track. This can be seen in the “Spectrogram” track view: Spectrogram View - Audacity Manual
I’ve tried spectrograph and I’ve attempted adjustments to it but I’ve never been able to make any sense out of it.
Before I try Melodyne, does anyone know how to adjust spectrograph so it is remotely readable?
Have you tried looking at the Queen Mary Vamp plug-ins ? They include some pitch analaysis plug-ins and work well with Audacity.
See: https://manual.audacityteam.org/man/analyze_menu.html#vamp
You can get the QM plug-in set from here: https://www.vamp-plugins.org/download.html
Search down the page for “Queen Mary plugin set”
WC