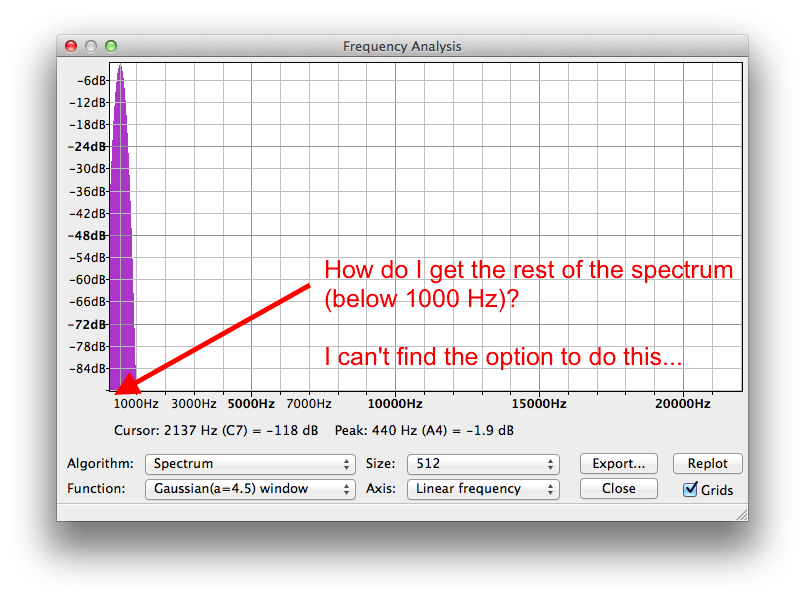
When I tell Audacity to plot the spectrum (Analyze > Plot Spectrum…), I get a window for the spectrum, but the axis is limited to frequencies of 1000 Hz or higher. I don’t see any controls to get the rest of the spectrum.
How do I extend the window to get the spectrum of frequencies below 1000 Hz? (See attached screenshot.)
(Due to the way this forum is setup, I cannot edit my posts. Therefore, I have no choice but to make a new post, which means that I have to double-post.)
To view the audio below 1000 Hz more clearly, set Axis to “Log frequency” instead of Linear. Linear gives equal graph width to each frequency increment on the scale, but Log gives more width to the lower frequencies.
“Double post” (which is bad) means making the same post twice.
Starting a new topic for unrelated questions is good. It makes it easier for users to search for answers to an exact question.
When you have made some more posts you will become an established user then you can edit your own posts. We don’t allow this until then because of the activities of spammers who like to post a relevant-looking question, then add their spam link into the post later.
The other thing you can do is grab the lower right-hand corner of the display and pull. The resolution of the display goes up as the panel gets bigger. In extremes, you can let the panel fall off the edge of the screen and keep making it bigger that way. Wouldn’t it be cool to have a magnifier tool?
The linear display, while mathematically accurate, isn’t very musical. Middle C on the piano is roughly 260 and the oboe “A” at the beginning of a symphony is 440. Hence A-440. AM radio only has tones up to 5000.
Alright this helped. I was going crazy searching all over the internet for “1000 Hz” and I already looked at the manual but didn’t see anything about a window limitation.
Yes the log frequency axis pull-down menu seemed to help.
It is not a limitation. The graphic display is not cut off at 1000 Hz, but the range below 1000 Hz has greater pixel width in Log view. I’ve added a note about using Log view for lower frequencies for the next version of the Manual.