Figuring out tab notes

Hey,

Discovered something helpful today that might help others, at least people into loops and
learning to play musical instruments (such as the electric piano).

I was trying to figure out a way to figure out what notes were being played in a synth bass loop
without having to hit VMPK keys and compare it using different soundbanks (very difficult).

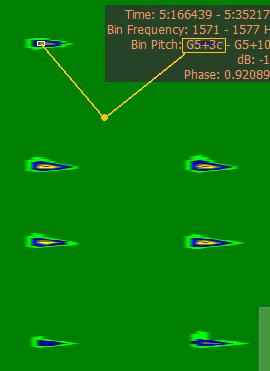
Anyway, I downloaded the program (Sonic Visualiser) and used the Melodic Range Spectrum
view. Well, that’s good for figuring out which notes are the same, but doesn’t help much
for figuring out the actual note (A2 or A#2) for example.

So, then I starts thinking, what if you measured one of the simple waveforms** in the loop
note (i.e. got it’s length) and compared that to Scientific Pitch Notation measures?

Well, you just take the scientific pitch for a note (For example: A2 = 110 hz), so that’s 110
simple waveforms per second. Then you divide 1 (second) by 110, and you get the length of
each A2 simple waveform 0.009091 (roughly).

You then measure each simple waveform in a note, compare it to the chart, and you get
a list of notes being played.

Pretty easy, though I’m not sure how accurate and you might want to test it by playing
the notes in something like VMPK. Also, I only tested on synth bass notes, so I’m not
sure if it will work with chords, etc.

Hope this can help. It’s always nice to have something cool besides “Red Red River”
to play when learning a musical instrument. I hate Mel Bay! :frowning:

-Pablo

**By “simple waveform”, I mean the smallest waveform that makes up an entire
“basic” waveform (which is a bunch of simple waveforms repeating).

Well, I’m well on my way in finally figuring out how to play “I Just Can’t Get Enough”
by Depeche Mode (which I used to play all the time back in 1989 whenever I went
into the electronics section of the now defunked local Best store).

Anyways, my “measure” the simple waveform doesn’t work for chords. I had
decided to wait a while before figuring it out, but then I decided to give the
ol’ “Sonic Visualiser” (a freeware program) a try.

I discovered that if you look at such chords using the Melodic Spectrum, then
place the cursor inside the spectagram “blob”, it tells you what the individual
note is.

Pretty neat, here’s an example of a chord:
Untitled.jpg
As you can see, that top note of this chord waveform is G5.

I tested it out (making a wav with VMPK) and it seems legit, though perhaps
a bit tricky…

Yeah for Sonic Visualiser 1.9!!

I think it’s ok to add a link to Sonic Visualiser http://www.sonicvisualiser.org/
and a brief (cut down) description from their web site:

“Sonic Visualiser is an application for viewing and analysing the contents of music audio files.”
“Sonic Visualiser is Free Software, distributed under the GNU General Public License (v2 or later) and available for Linux, OS/X, and Windows. It was developed at the Centre for Digital Music at Queen Mary, University of London.”

Well, I was well on my way to getting some really good piano-synth tab going when
I hit a stumbling block today while trying to get that synth bass tab from Nitzer
Ebb’s “Join in the Chant”

I thought others might find this useful (especially if they don’t “get” what I was
talking about eariler…about basic waveforms and such as used by piano-synths).
Anyway, hopefully this demonstration helps…

First off, Sonic Visualizer is a GREAT program and the melodic visualizer can be
a helpful tool when finding single hit/stab melodies. However, often with single
hits, the blobs are quite large and can become confusing.

This is why measuring basic waveforms is crucial to determining the correct
note/pitch of a particular note.

ODD WAVEFORMS
The problem I ran into today was that the recording I obtained of “Join in the
Chant” had particularly odd looking waveforms that were a bit difficult to
measure. Here, take a look…
Measuring Odd Waveforms.jpg
As you can see, the melodic spectagram of Sonic V. has large blobs that show
many notes. The second Audi126 waveform graph is a rather easy measure,
you find a repeated “graph” shape and measure between the two. The third
Audi126 graph is where the trouble can happen. After much searching, I
finally found two similar occurances of graph and was able to measure,
Sonic V confirmed the measurement.

Hope this helps!
BTW…Join in the Chant by Nitzer Ebb:
F1 F1 F1 F1 G#1
G#1 A2
F1 G#2 G#1 A2 G#1
…I’m pretty sure this is correct, it’s difficult to confirm using the
Roland gm.dls soundbank of windows (Synth Brass sounds somewhat
similar).

Also, here’s an idea of a way to do a pitch notation chart for these
purposes:
IPN-WavelengthZ.xls (21.5 KB)

Owww, I figured out a new way to write piano-synth tab.
Those familiar with 16 step sequencers may find this useful.

===================================================================================
TAB: Triumphant Brass
===================================================================================
  | B01  B02  B03  B04  B05  B06  B07  B08  B09  B10  B11  B12  B13  B14  B15  B16
==|================================================================================
01|[C#5][~~~][E5 ][E5 ][~~~][D#5][C#5][~~~][C#5][~~~][E5 ][E5 ][~~~][D#5][C#5][~~~]
  |                                       ^^
02|[A#4][~~~][A#4][C#5][~~~][C#5][E5 ][~~~][A4 ][~~~][A4 ][E5 ][~~~][E5 ][D#5][~~~]
  |
03|[---][---][---][---][---][---][---][---][---][---][---][---][---][---][---][---]
  |
04|[---][---][---][---][---][---][---][---][---][---][---][---][---][---][---][---]
  |
==|================================================================================
NOTESINFO:
===================================================================================
01. 
02. 
===================================================================================

In my tab, the “~” means a note is playing, not a rest. I did this becoz
it resembles a waveform better.

4 Measures, 16 buttons, space below for notes. Works well for chords too,
but don’t forget to put the chord notes below the tab in the notes section
or something…ha ha :blush:

This is the brass part from the kit loop pack “Dr. Lex’s 808 Halloween Special”,
Kit 01 in case you are wondering…

You may be interested in this section of the Nyquist manual: http://www.cs.cmu.edu/~rbd/doc/nyquist/part11.html

Not everything here is implemented in Audacity, but basic Adagio notation is implemented (in Audacity 2.0)
In particular:

W (whole, 4 beats),
H (half, 2 beats),
Q (quarter, 1 beat),
I (eighth, 1/2 beat),
S (sixteenth, 1/4 beat),
% (thirtysecond, 1/8 beat), and
^ (sixtyfourth, 1/16 beat).

See here for other predefined constants: http://www.cs.cmu.edu/~rbd/doc/nyquist/part2.html#14

Here’s some of my tab sheets, I think they’re pretty “solid”.
TaB02-000-genre–name (Measure 00).txt (3.27 KB)
TaB02-110-PL-PCG-NewBreed–Drum Mix (Measure 01).txt (3.49 KB)
TaB02-090-DA-DRE2-K20–Synth Bass (Measure 01-04).txt (3.38 KB)
These support both Buttons and Subuttons, and can be modified to support multiple
measures (for things like single channel tab such as synth bass).

You might note that each button now has four “-” dashes, those can be used to
represent the 4 sub-“bars” of a sub-measure (16 steps inside a button).