Engine noise reduced (HBN) - Does Audacity tell the story?

Audacity 2.2.0

I added Hexagonal Boron Nitride to a 1996 Golf MK 3 1.4 Petrol engine, and recorded the operation.
It took 2 min 20 sec to circulate, and the engine noise dropped.

Our ears pick up the fact that the engine components are now rotating with less friction … there is less knocking.
Job done?

Ha!
I figured that it would be interesting to see what Audacity could tell us.

It definitely highlights the drop in noise; so why not share it with the video?
… only I realised that I don’t truly understand sound
… and not wanting to talk bollocks, I thought that this question might be an interesting share, and I might learn something :slight_smile:

Method
The sound speed was halved (rightly or wrongly) to stretch out the waves.

There was a repeating sound sequence around 0.35 sec in length.
This allowed an aligned selection of ‘before and after’, with sufficient detail to make it worthwhile.
(at 1:30 and 3:00)

HB-Now_before-after_zoom.png
It is evident at a glance, that ‘before’ is much noisier, but I then zoomed in to 0.03 sec.
Again, the two clips were aligned as best I could, using the starting spike of the sequence.


HB-Now_before-after_ultra-zoomed.png

Analysis

The engine is well used … note that even after the HBN has circulated two components tap together and create a spike in noise, though it appears that most components benefit from it’s presence.

What I don’t understand are the two deep troughs, 2/3rds along and at the end of the sequence (after circulation).

Here is the moment when the HBN completes it’s circulation - at half speed and mixed to mono:

the engine components are now rotating with less friction … there is less knocking.

Those are different. “Knocking” is caused by having the fuel ignition at the wrong time, or having more than one explosion. Less Friction appears as bearing wear and while it reduces the life of the engine, it doesn’t necessarily make noise. If the engine does start squealing and it’s not belts, it’s on death’s door and you should be looking for a replacement car.

and not wanting to talk bollocks

“Bollocks” is a special download.

If somebody said I had to do this, I’d record the engine noise with a good quality microphone, apply the fluids and make a second recording absolutely changing nothing else. No volume adjusting volume or moving the microphone around.

Then, in video post production, switch (or even better fade) between the before and after videos and the two linked sound tracks. Change the Chyron on the screen when you do that. People will swear they hear a change even if there isn’t one.

Koz

Well yes, I’m well aware of engine knock due to ignition problems.
This isn’t a mechanical engineering forum, so I used ‘knocking’ to describe ‘knocking’.

In fact, overall, I don’t ‘get’ the tone of your response.

I didn’t have a high quality microphone … I used an LG4 mounted on a tripod.
Perhaps not perfect, but it did the job, and successfully recorded the engine noise transition.
This was the objective.

I entirely disagree with your proposed method of recording the event.
A second recording would be pointless.

The only recording that counts, is when the engine is running and settled.
In this way, the change in engine noise can only be due to the full circulation of the HBN.

(BTW there was a very minor change that occurred a little earlier, but the full impact was noted after full circulation was achieved.)

As for ‘switching’ and ‘fading’ … Ha!
Certainly not for the primary element of the video; which must be uncut from dosing the engine, through to transition.

There is certainly room for subsequent ‘switching’ between earlier and later clips (of the original take) … but definitely not ‘fading’.
Switching would allow immediate comparison.
However, even this is not required, because the transition took approximately 1.5 seconds, and at the outset, the noise dropped significantly, and continued to drop.
… so no need for your implied suggestion of fakery.

I run an engineering help channel … everything has to be as it is; fail or success.

Having said all that; I am interested to learn what can be understood from the two wave troughs.
It is not clear to me, how this relates to sound.

:slight_smile:

I think frequency analysis will be more useful than looking at the waveform …

Golf-SPAN.gif
https ://manual.audacityteam.org/man/plot_spectrum.html

https ://www.voxengo.com/product/span/

Many thanks to Trebor for this suggestion :slight_smile:

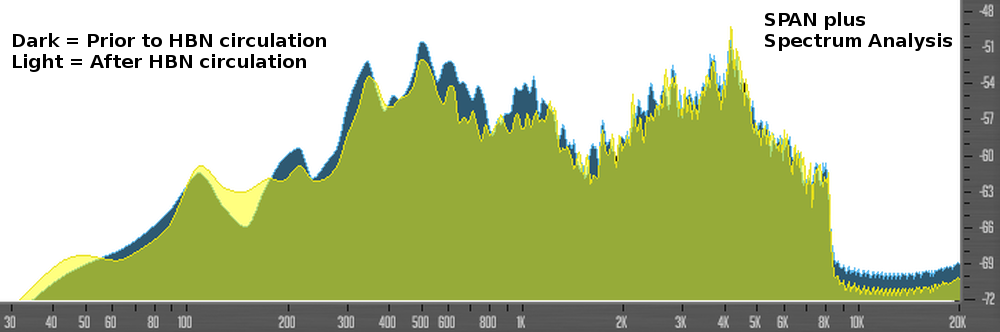
SPAN plus Spectrum Analysis hb-now-golf-mk3_transition_mono.wav

Method

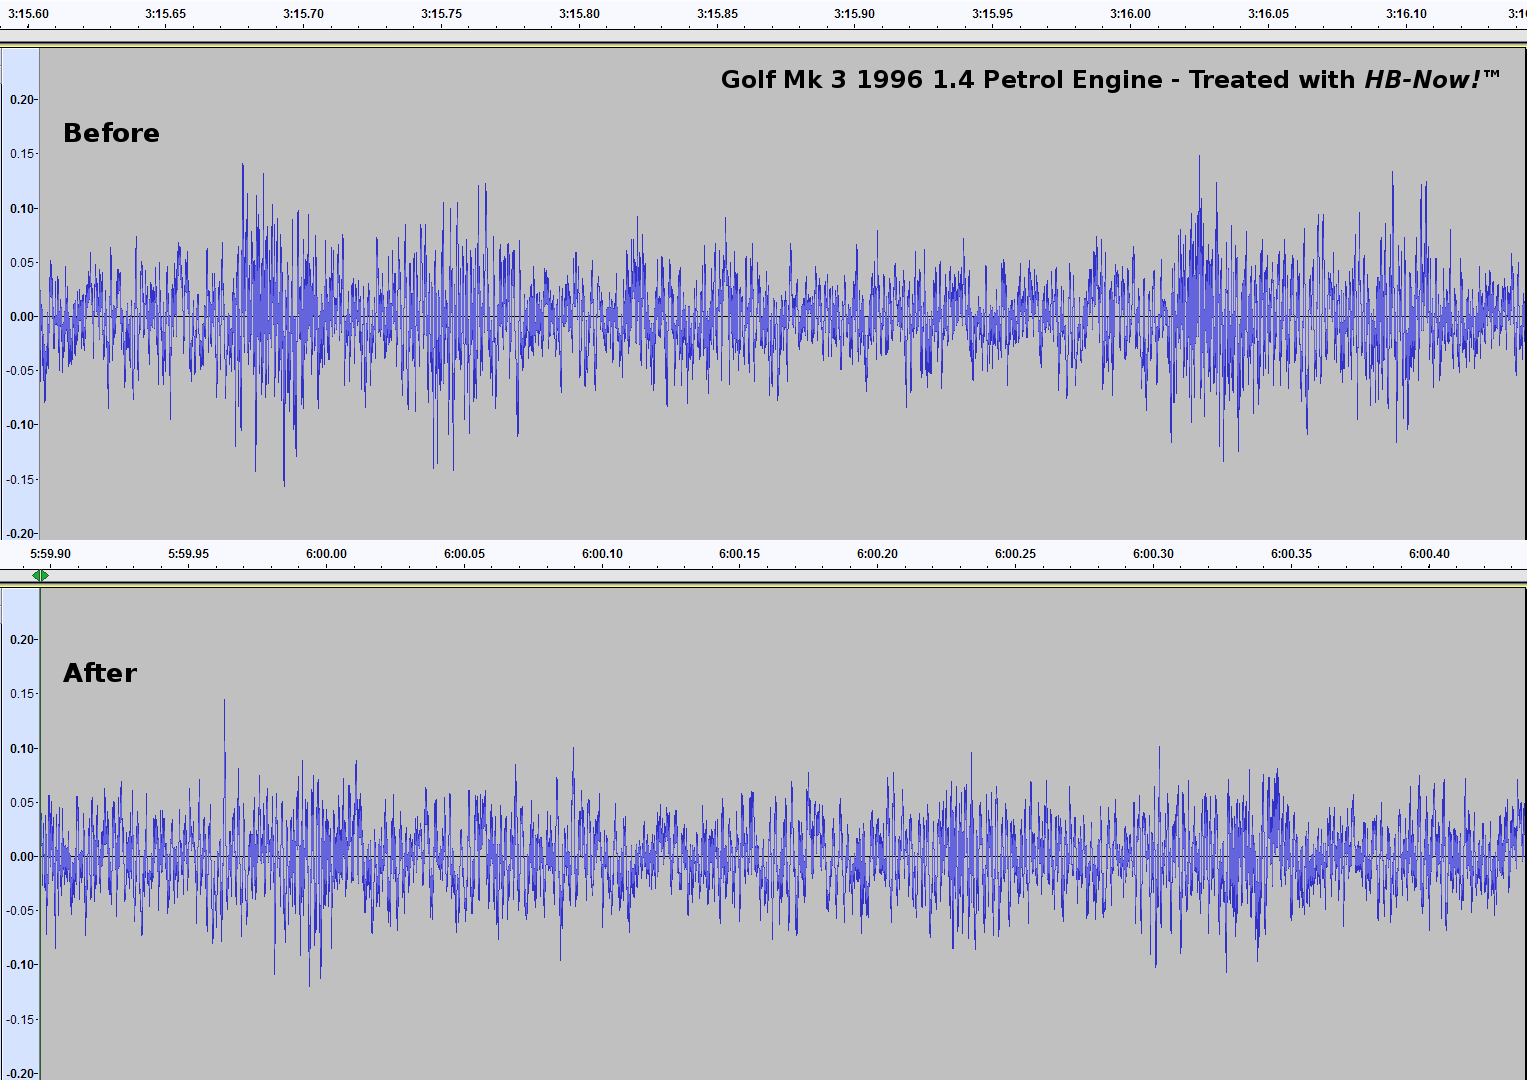
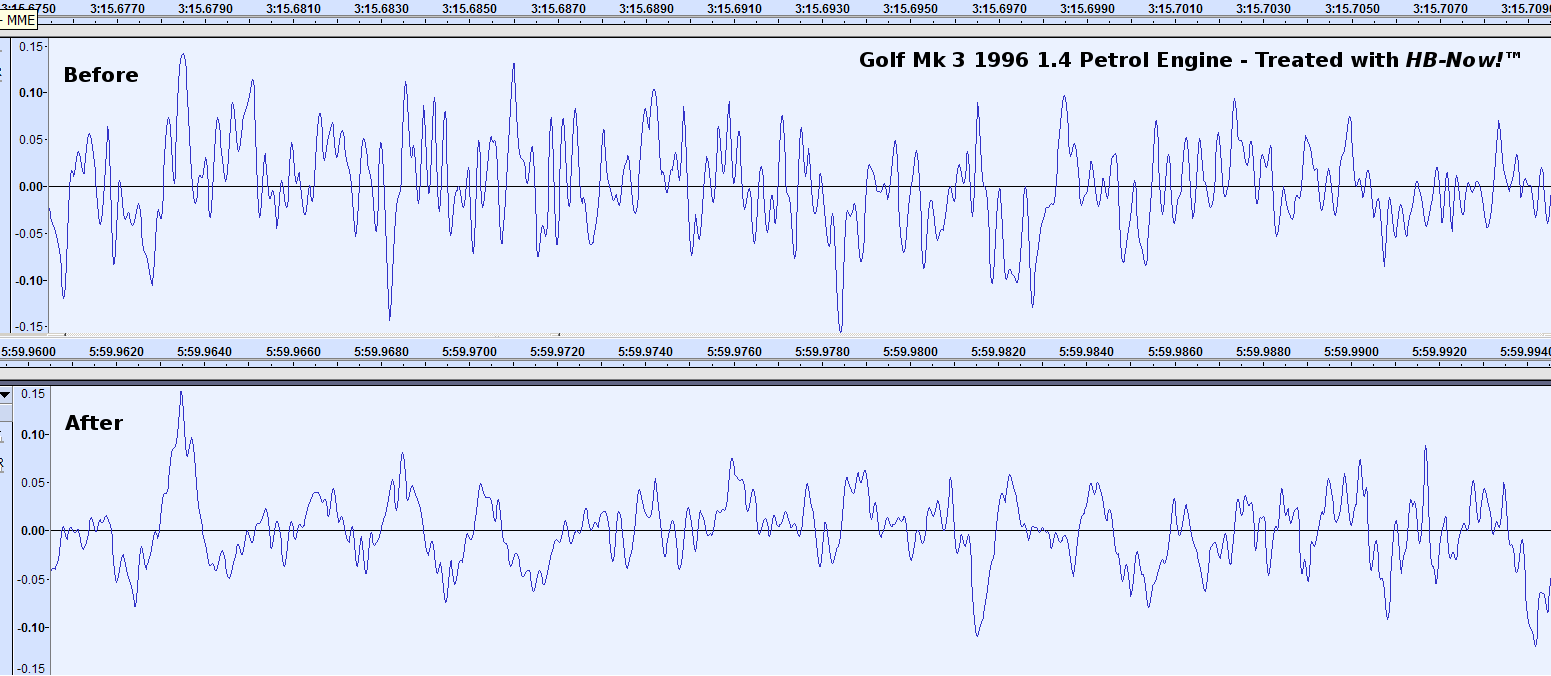
The first and last second of the audio file were graphed in SPAN plus using default settings.
Each graph was exported to image.pgn then imported to GIMP.

Alpha channels were added.
Chart background removed.
The chart foreground of ‘the last second’ was replaced with a transparent colour, to enable overlay.

Note:
‘SPAN plus’ was chosen, over ‘Plot Spectrum’ as the latter dB axis could not be locked.
This prevented comparative overlay.

Analysis Concept

By overlaying the ‘after audio’ over the ‘before audio’ … a form of analysis might present itself.


Analysis

Preamble
A piston engine creates noise due to components rubbing or knocking together, displacing air/gas, and explosions.
A worn lubricated bearing might produce a low frequency rumble.
An unlubricated bearing might produce a very high pitch squeal.
A large worn reciprocating component might produce a low pitch knock.
A small reciprocating component might produce a mid to high pitch knock.

Certain components, such as ‘valve actuation’ involve direct impact of metal upon metal, potentially mid to high pitch knock.
However, it is worth noting that, unlike earlier pushrod ‘tappet valve actuation’
… the overhead camshaft impacts the valve with a glancing blow, followed by rubbing.

Clearly, some noises are independent of lubrication, but a large proportion can be ameliorated by lubrication, or improved lubrication.
… particularly worn engines, where component interfaces are larger than when the engine was new.

These larger interfaces can be filled with larger lubricating oil molecules (effectively larger ball bearings).
This route may be worth pursuing - it is sound engineering practice (hence differing grades of oil).
However, some components may have worn less, and may still require ‘thinner oil’ (so be careful - small increment change is wise).
Also the thicker oil may be more problematic when beginning circulation in cold temperatures (at engine start).

In modern engines, almost all component rubbing or knocking, is a function of rotation
Increased lubricity (of the oil) will ameliorate engine lubrication in all situations (where sufficient oil pressure is being maintained).

Hexagonal Boron Nitride particles provide this increased lubricity.
This molecule is stable under pressure, and when dispersed in the oil, presents an ever-present lubricant between metal surfaces (particularly useful at engine start).

By adding this molecule to the oil, in a worn engine, we would expect to witness a reduction in noise that is being produced as a function of rotation.

Can engine noise be eliminated - or does it change it’s form?

A well designed bearing may make no discernible noise, when adequately lubricated.
Therefore, we can expect that, after HBN introduction, some noise might effectively disappear.

However, for a worn engine, the prediction would likely be, that the original component noise will drop in pitch (with improved lubrication).
Ie. Noise will still be created, but it will be dampened, like hitting a bell via a piece of leather.

Therefore, we would expect a downwards shift in frequency.
In chart terms … a leftward shift in the ‘volume’ of noise/frequency instances.
… with a corresponding increase in lower frequency sounds.

Let’s have a look:


Note:
I’m going to use the term ‘volume’ to describe the quantity of noise under a given section of the curve of the graph.
This may correspond to the traditional sense of audio volume … or not.

Confirmation of this, or better terminology is required.

8.3K - 20K

Better than a 50% reduction in high frequency sound - sharp rubbing and knocking.
This is very good news for engine wear and efficiency.

However, those engine components are still producing noise, but the improved lubrication means that the noise is of a lower pitch.
Therefore we can expect that noise to show up in the volume of lower pitched noise.
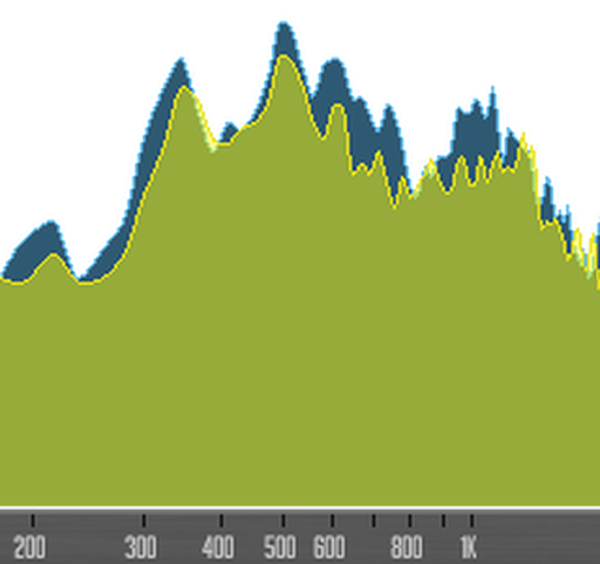
1.7K - 8.3K

We can see a distinctive half wave curve, from 1.7K to the cliff edge of 8.3K (nature is mind-blowing).

While there is a reduction in the ‘volume’ of noise in this pitch band
… it is not great, and we can see that at some odd pitches, there is greater volume than prior to HBN treatment.

From this, we need to make an ‘informed guess’.
Ergo … that most of the original component impacts were reduced in intensity, but that reduced volume now, is augmented by the component noise that previously was in the higher pitch region.


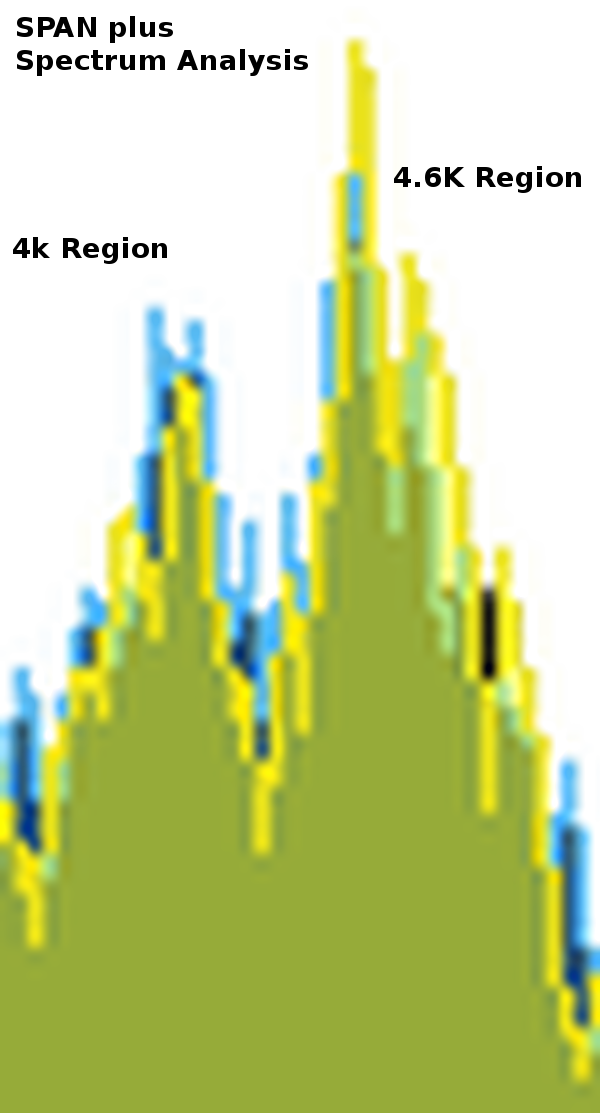
The 4.6K region is encapsulated in yellow bias.
The 4K region is encapsulated in blue bias.

Clearly, there is a notable component impact, that has settled in the 4.6K region - slightly more than was originally present.
… unlike per-chance in the 4K region :smiley:

This is a very positive sign.
Increased lubricity cannot increase the impact noise pitch.
Therefore, this is confirmation that ‘component on component impact’ has been reduced, with the resulting noise pitch being relocated at a lower level.

Nice!

180 - 1.7K

Let’s disregard the anomaly of 180 - 240 (apparently a happy place for noise).
Instead, we can go with the flow of nature, and see the half wave curve from 180 - 1.7K.


There are two or three minor areas showing an increase, but we now understand this.
… overall, there is a significant reduction in the volume of noise in this ‘pitch region’.
… far more than in the previous 1.7K - 8.3K region.

Where has the noise gone, from that previous region?

I believe that we must think deeper.
Those highest pitched tapping/screeching noises were reduced to the 1.7K - 8.3K region
… but those components have a limited noise generation capability.

They can reduce down from natures highest pitch, to the second highest pitch
… but thereafter, it would seem that the second highest pitch cannot transition to the 3rd highest pitch region.

They probably don’t have the mass, and the additional lubricity simply ‘keeps them in their place - rotating nicely’.
In effect (as witnessed) … a proportion of the component impacts are eliminated (because they don’t add to the 3rd highest pitch region).

… and we still have significantly reduced component impacts, that create noise in the 180 - 1.7K region.
… but those impacts still occur.
Will we see an increase in the lowest pitched noise?


32 - 180

Golf_mono_spectrum_analysis_32-180.png
Once again, we see nature at play.
For whatever reason, the impact noises (due to additional lubricity) find their home in two distinct regions.

Alan Turin (when he was killed/committed suicide) was researching nature’s fundamental requirement to form patterns.
… we see it here.

Summary

Taken at a common sense level
… what we see, is easy to understand.

The additional lubricity reduces impacts/rubbing, causing the noise to drop in pitch.
The components creating the highest pitch noise, are the components that can be easier supported by the additional lubricity
… therefore they no longer make noise.

Apparently, this impact noise reduction, forms into two general patterns (in overview).
However, it is also apparent that the noise is finally reduced to a level that is not recognised by the microphone, or the analysis software.

Neither of these latter two provisos impact upon our general understanding
… that is:

Hexagonal Boron Nitride particles provide increased lubricity, and is beneficial, in terms of reduced engine friction
… ‘noise’ being a primary indicator.

Ha!
… and by strange (and rare) good fortune … I have loads of the stuff :smiley:

How annoying will that be (to the few)? :sunglasses:


Management Summary: lubrication is good and useful :sunglasses:

WC

The cliff-edge is an digital artifact: the device you were using to record was set at a sample-rate of 16kHz,
that records up 8kHz, (Dictaphone quality).
So everything above 8k on that is digital noise, not real-world noise. Just ignore it …

Ignore above 8kHz.gif

But does it interfere with fuel-combustion, or human health ?.

Hahaha perfect!

__

Why are you telling me all these details???
Just give me the conclusion!

… sorry boss … you need to put oil in your car.

…Okay; I’ll schedule that for next week when I get back from my trip to Scotland.

:smiling_imp:


The answer is NO to both those questions

The crystals are added to the oil not the fuel.
Fuel consumption will drop, as the engine will run with increased efficiency.

The substance is not hazardous, and not toxic in a normal use scenario.
Ie. It is not a food product.
Apparently, tests on rats indicate that 2g per Kg consumed would be lethal.
So if a human somehow managed to consume 160g of it…
Safety Data Sheet – Hexagonal Boron Nitride


Thanks for that clarification :slight_smile:

I’m wondering though…

Both charts were produced from the same audio file.
The ‘after’ chart did show a lower ‘digital noise’ than the ‘before’ chart.

Can we simply take a visual perspective from this?

By that I mean…
There may be no relevance to any digital examination of the ‘digital noise’, but as a ‘volume under the curve’?
It seems that we would expect less noise, and this was indicated.

To test this theory, I will repeat the procedure with other vehicles.
You can imagine … there is no shortage of people wanting to have their engines treated.
I’m going to record all them.

One friend has a fairly new car, with only around 30,000 Km on the clock.
That will be an interesting test, as it shouldn’t be a particularly noisy engine.

I also have a diesel that is well used, and is quite noisy … that will be a good test.

By graphing them all, we will see if the volume of digital noise drops in all cases.


Regarding your own chart:

Could you spare the time to explain it?
It is not clear to me why your background curve was so much higher than the active curve.

I figured that you used ‘screen to gif recorder’.
Nice!
I’ve just downloaded a copy :slight_smile:

I have learned how to display a fixed curve from one audio portion
… and then run a different audio portion.

This is a great feature.
I was able to run a longer earlier portion of the audio, and save the image.
Then I ran the ‘after’ section of audio.

This produced an even greater difference in before and after.
It’s also a helluva lot easier than messing around in Gimp :slight_smile:

Golf_mono_spectrum_analysis_SPAN_overlay.png
:slight_smile:

A small quantity of lubrication oil is going to be burned, and undergo chemical-change in the process.

It would be possible for an additive to simultaneously reduce-friction, & retard combustion if it gets into the cycliders. (Give with one hand and take away with the other).

I set the background spectrum to show the maximum values reached, (a/k/a peak-hold ).

Thanks Trebor :slight_smile:

These are very worthy points to raise…
However, neither of these scenarios can produce any polluting effect whatsoever.

Combustion
HBN particles play no part at all in the combustion process.
It doesn’t burn, and it is not present in the air/fuel mix.

With the most worn engine imaginable (that is somehow still running) the HBN nano particles cannot be involved in the combustion process.

The combustion process doesn’t work in that manner … not that such a minuscule proportion of any foreign object would have any effect, even if it was injected into the air/fuel mixture.

Even the oil clinging to the cylinder wall (that is actually combustible) cannot burn.
In a worn engine, it is chucked out of the exhaust as a goo.

Just getting ‘highly combustible fuel’ to burn is hard enough (under the extreme conditions of the combustion chamber).

Not an advert, but if you are interested in getting your fuel to combust … go to my website fuelmapper.com.
I have written a unique software application that can assist in this area.

From a combustion perspective, the HBN particles (literally) don’t exist!

Exhaust fumes
HBN is a refractory compound of choice, due to it’s resistance to heat.
A very old engine might consume small quantities of oil, but the HBN molecules will either cling to the metal surfaces, or be perhaps blown out of the exhaust as a non-toxic particle (that is mixed with the normal highly toxic particles emitted from the exhaust).

Pretty much, everything that leaves the exhaust is toxic except HBN.
If HBN was the only substance emitted through the exhaust, we’d be laughing.
… though it would most likely never leave the exhaust.
Almost certainly, it would be trapped in the baffles


Nice!
Specialist software always has a learning curve… particularly when one doesn’t really understand the subject.
I sympathise with myself, because I know that everyone who downloads my own software, hasn’t a genuine understanding of the subject (even if they think that they do) :wink:

Thanks for your help and guidance.
If you need to tune your internal combustion engine … I will gladly reciprocate :slight_smile:

Berlingo 1.9 Diesel - HBN Test

This test didn’t go smoothly.

Somebody turned up needing to speak to me, just as I was starting the test.
The oil filler hole is quite small, and some of the oil/HBN mix blew back.
The HBN circulated much faster than occurred with the Golf petrol engine.
… and diesels are inherently quite noisy.

I didn’t notice the change in noise, as I was busy adding the last drops of residue :laughing:
It only took around 30 seconds to circulate.
I discovered this when I played back the video.

The slow circulation in the Golf engine is indicative of the amount of wear, and likely reduced oil pump efficiency.

To improve the audio recording I used an add-on mic, with open slots around the circumference.

mini_mic(sm).jpg
When tested, the sound pickup was much better compared to the LG4 mic, that is tucked away in the body of the phone.
Below are comparative images of the audio imported from the video, both zoomed to the same scale.
The top image is the LG4 internal mic.
The bottom image is the LG4 with add-on mic.


Golf_LG4_mic_(sm).png
Berlingo_LG4_add-on_mic_(sm).png

Using SPAN plus I graphed 1.5 sec - 4.5 sec while the filler cap was on, and saved the image.
I then sampled various 3 second periods after the HBN had been added, and the filler cap replaced.
They were all similar, so I saved the last graph at 9.01 - 9.04

Berlingo_HB-Now_1.5-4.5 _9.01-9.04.png
When compared to the Golf 1.4 petrol engine, the 1.9 diesel creates more noise.
… and there was less noise reduction.
Presumably the diesel engine is tighter and less worn.

Point to note:
Once again, there is a reduction in digital noise.

The Golf Test


Overall

It seems clear that Audacity, when combined with SPAN plus, can tell the story of engine noise reduction.


I’ll likely round off this series of tests with a modern car engine, whenever it can be arranged.
If the trend is anything to go by, we may see little reduction in noise.
However, it will be a worthwhile test.

:slight_smile:

Audacity’s Native equalizer will enable you to isolate the 100Hz-1000Hz range where apparently there has been an improvement.

SPAN has a facility to do that, (real-time band-pass filter), but it doesn’t work properly in Audacity.

SPAN in OCENaudio.gif

Berlingo 1.9 Diesel - HBN Test

Isolating the area of improvement

Thanks to Trebor for guidance.

This additional analysis may primarily be beneficial for educational purposes.
However; from that, real world application might arise :slight_smile:

As I understood Trebor’s direction … I could eliminate the frequencies that changed little between before and after engine treatment.
This would then provide a truer picture of the reduction in engine noise.


Method

3 second audio clips before and after, were pasted together sequentially.
Both clips were then copied to the same track, then filtered to leave frequencies 130Hz to 1700Hz.

The resulting wav file was just too large, so an MP3 version was uploaded.

In this case, without equalisation, the ear can anyway distinguish the overall drop in noise, but this may not be always the case.


Berlingo_audio_freq_isolated_to_130Hz-1700Hz.png
Berlingo_Equalised_settings_130Hz-1700Hz.png
Berlingo_audio_and_equalised_audio_130Hz-1700Hz.png

By listeneing to the isolated sound you may be able to identify which part of the engine benefits most.

Your equalization has a 20dB cut. To totally exclude the other frequencies >100dB is required …

100-1000Hz bandpass.gif
The green line is the actual equalization being applied.

Thanks again Trebor for your guidance.

Yes, this would be the ultimate goal :slight_smile:

The obstacle is the lack of reference points.
However, I think that we have already done very well in this matter.

The very fact that some frequencies increase (post treatment), indicate that those must have come from even higher frequency contacts that have been attenuated.

This though, presents a fundamental barrier to analysis, at least in an old engine.
(the modern engine may prove interesting)

Considering ‘the leather between the hammer and bell’…
The sound is still created, but the frequency is shifted lower (into another component range).
It means that ‘specific frequency volume comparison’ is confounded.

Perhaps the solution would be stethoscope type recording, rather than open air mic.
I’ve just had a quick look and discovered that the stethoscope has two inputs - high and low frequencies.

I watched a quick vid on youtube of one being made (in the simplest manner).

His follow up video was a bit lacking, as he didn’t show comparison between the high and low frequency capture.

There will surely be others.

It might enable two recordings for each placement on the engine.
Ha!
Another prototyping project :nerd:
Perhaps someone has experience of such a device.

Re the mod to equalisation graphing
Thanks for that.
I will carry out that update :slight_smile:

Stethoscope Type Recording

Just had a look at the options.
There are two formats.

Metal rod in contact with the engine
Medical type with a bell and a diaphragm.

stethoscope_bell_(sm).jpg
stethoscope_mech_single_(sm).jpg
stethoscope_mech_double_(sm).jpg
stethoscope_diaphragm_(sm).jpg

The diaphragm looks impractical.
The bell makes contact via an o ring.

The steel rod types appear to pass the sound into a chamber, which perhaps has a diaphragm.

I’m wondering if it would be just as effective, with a steel rod with a silicone tube over it and a small microphone in the other end of the tube?

Perhaps the sound chamber allows the instrument to be held, without affecting the vibrations?

In the past I have simply used a screwdriver, holding my ear to the handle.

:slight_smile:

On reflection, I’m thinking that the metal rod in physical contact with the engine, is likely to produce the best results.

I’m guessing that any diaphragm in the mechanical stethoscope, is there to amplify the sound waves through the tubes to the ears.
This wouldn’t be needed for a microphone, and might even be detrimental.

Perhaps if the microphone was placed extremely close to the tip of the rod
… surrounded by, and connected to the rod, with silicone tube.

The thing is…
It’s not clear to me, vis a vis recording direct metal vibrations, and the movement of air that is pushed towards the mic diaphragm/sensor?

Also, the metal rod itself.
Perhaps it will need some shrink wrap around it, to dampen its own resonance?

Anyway, I’ve ordered another TRRS mic on a long lead, plus capacitors and resistors, to make up a mic from the mic heads that I have.
Does anyone have any thoughts on this?

Great thread. A lot to be learned.