This is just a simple (very simple) tool.
- You use Audacity to generate a sine tone (“Generate” menu).
- You connect the computer sound card output to the input of the device under test, and the output of the device to the recording input of your computer sound card.
- For testing amplifiers it will probably be necessary to use some sort of “potential divider” to attenuate the signal so as to avoid overloading the input of your computer sound card, but as long as it is reasonably well shielded from interference, a simple 2 resistor divider (or a low noise potentiometer) is unlikely to cause significant noise or distortion (assuming that we are not talking about high power amplifiers that make the resistors get hot).
- You set Audacity to “play back other tracks while recording new one” (default) so that your generated tone is played through the device, and recorded onto a new track.
The new track that you have recorded, assuming that your sound card and the device under test are perfect, will now have an exact copy of the original track (we are not testing for differences in amplitude or any propagation delays).
However, we are aware that nothing is ever perfect, so we are testing to see how much the recorded signal differs from the idealised sine wave.
The assumption is that any distortion or noise that has occurs through the device will introduce additional frequencies (in addition to the test tone). The exact level of the recording is not important as the plug-in simply measures the distortion as a proportion of the recorded signal.
If the system was perfect, then the recorded signal would be a pure sine wave at the same frequency as the generated tone. Let’s say that our recorded signal has an amplitude of 0.764
By using a tight notch filter (in this case it is a digital filter, but it is essentially the same as the twin-tee filter in the hardware analyser) we can remove the sine wave at out test frequency.
A quick note here - the sine wave that is generated in Audacity is extremely accurate, and just limited by the sample rate, bit depth, and precision of the sound card.
So after we have removed the sine wave, any signal that remains is the crud that we want to measure.
“crud”/“recorded signal level” x 100 = % divergence from a perfect (zero distortion) system.
So if the “crud” measures at 0.021 amplitude, then the distortion will be reported as (0.021/0.764)*100 = 2.75%
Of course, before drawing any inferences from the results, it would be necessary to test the sound card itself (a simple loop-back connector from the output socket to the input socket). And not forgetting to type the test frequency value and not rely on the sliders (which are hopelessly inaccurate for this sort of thing).
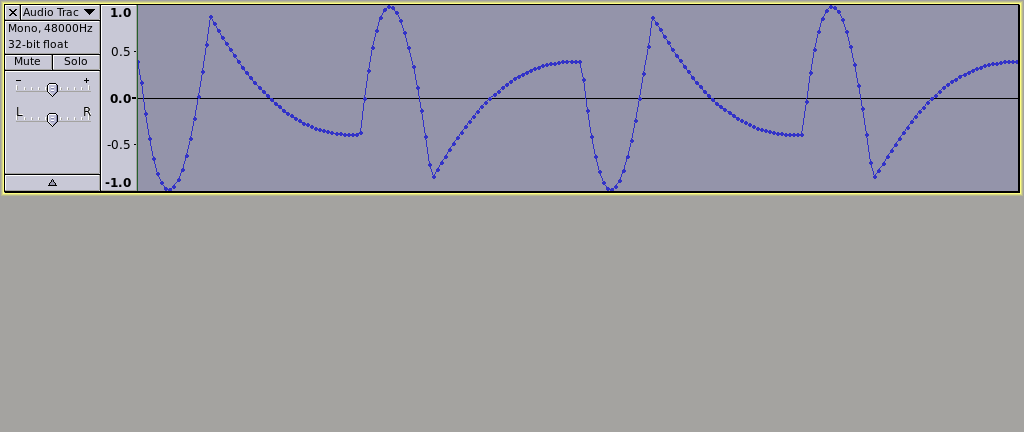
I’d expect not, but did you realize that “flat-topping”, after the sine tone has been removed looks like this:
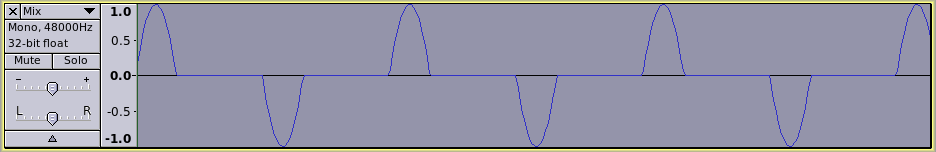
Which is harmonically identical to this (only difference is the phase relationships of the harmonics):
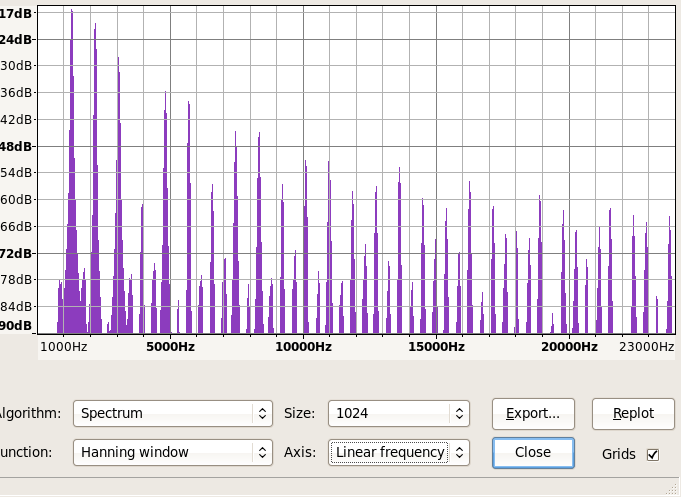
and it has a spectrum that looks like this:
(Well I guess that you would expect that koz, but I think it is quite surprising the first time that you see it).
I could modify the plug-in so that there is an option to produce a “notch filtered and normalised” wave output if that would be useful. (It is not possible to produce both an audio track output and a text output at the same time, although a text output could still be produced in the “debug” output.
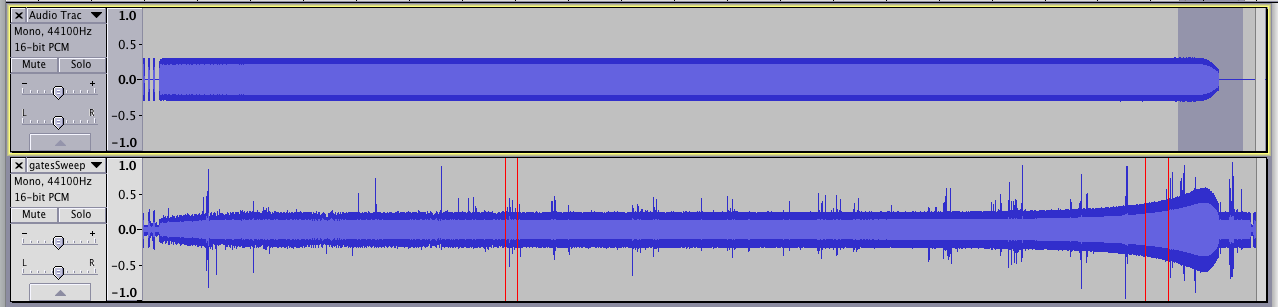
One other thing here, is that the first bit of audio through the notch filter is rubbish because of “ringing” caused by the high Q of the notch filter (the first 20,000 samples of the selection are ignored by this plug-in and only the following 20,000 samples are measured).
Anyway, after all of that, I’d be interested to hear if the distortion figures from this plug-in bare any relation to the figures from your hardware test equipment.