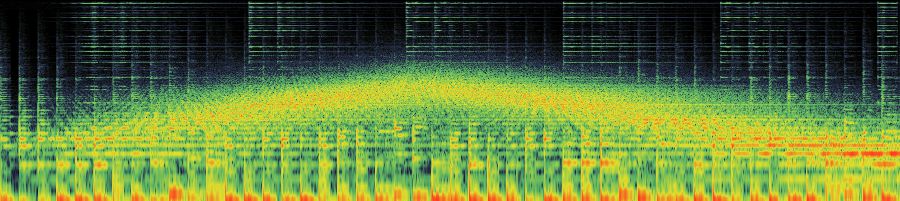
spectograms depending on settings, lack the time-precision of waveforms
this should be faster than spectrograms,
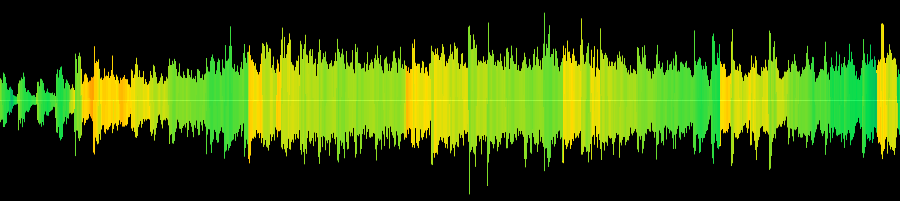
split audio into multiple windows/freq-band channels, e.g. 0-700hz, 700Hz-4khz, 4khz
take some of the amplitude waveform data and use that info to control the color of the waveform
example is quick&dirty perhaps something nicer (not plain RGB channels, different palette, more than 3 bands, smoother taper, white balancing)
If you set the “Window Size” in Spectrogram settings to “8”, that gives 4 frequency bands.
Approximately:
0 to 3 kHz
3 to 8 kHz
8 to 14 kHz
14 to 20 kHz
and a time resolution of about 0.14 milliseconds.
(Spectrograms Preferences - Audacity Manual)