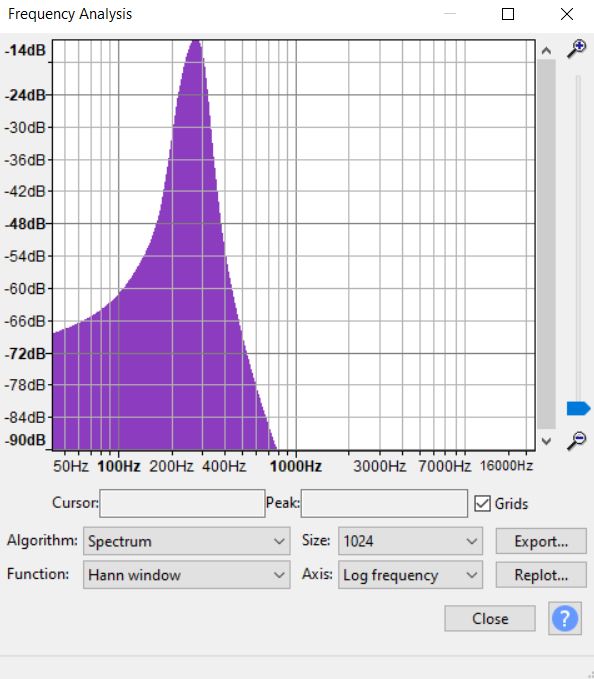
I went to Generate > Tone and entered lets say 272 for the frequency and then I highlight a major part of the track and went to Analyze > Plot Spectrum to view the frequency analysis.
Can anyone tell me what is going on in the graph? Why is the peak frequency 274 Hz instead of 272 Hz? why is the graph showing so many different frequencies across negative decibels when the only frequency is 272?? How is this possible when 0 decibels means no sound? What is the point of negative decibels and why are there frequencies for negative decibels?
Decibels need a reference. The 0dB reference for dB SPL (acoustic loudness) is approximately the quietest sound you can hear so dB SPL levels are positive.
The digital reference is 0dBFS (zero decibels full scale) and it’s the “digital maximum”. With integer formats, it’s the maximum you can “count to” with a given number of bits so digital dB levels are normally negative.
Audacity uses floating point internally which has a 0dBFS reference with a numerical value of 1, so Audacity itself can go over 0dB.
…When you play a digital file it’s automatically scaled to match your digital-to-analog converter so a 0dB 24-bit file is not louder than a 0dB 8-bit file, even though the numbers are bigger.
There are also decibel references for for electrical signals.