Hi.
I study very low frequencies, below 1000 Hz.
I record sound at frame rate of 220 fps.
When i show the spectrogram, scale MEL is ok (also others).
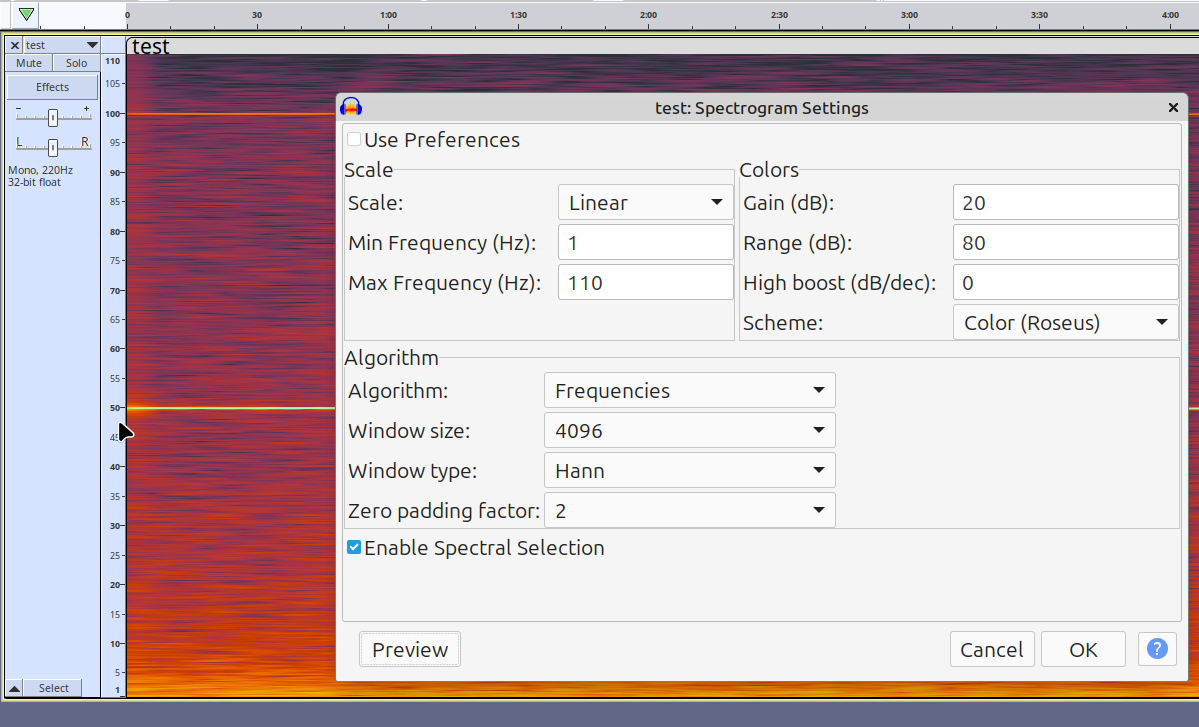
But the LINEAR scale is shifted down by 0.5 hz.
Infact, in other scales, i see a strong signal at 50 Hz, but at LINEAR scale this carrier signal is at 49.5 Hz. Why ?
I’m not an expert but FFT which is used for frequency analysis is complicated and “imperfect”. The spectrum and spectrogram may use different settings.
It analyzes in linear frequency bands which they call “bins”. The fact that it’s linear means that as a percentage, it’s less precise at low frequencies than at high frequencies. i.e. if the bins are 10Hz wide that’s more significant at 50Hz than at 10kHz. The size of the bins is related to the sample rate and the FFT size.
There is also “windowing” to smooth and combine the beginning and end of ends of the group of samples that’s analyzed together (the “size”).
The “Window Size” setting determines the number of “FFT bins”. The number of FFT bins determines the frequency resolution. The bins are NOT centred on Hz divisions, they are evenly distributed between 0Hz and fn (the Nyquist frequency - half the sample rate).
For a “Size” of 256, the frequency bins around 50Hz are centred on:
48.984375
49.843750
50.703125
So a 50Hz tone will mostly land in the 49.8Hz bin, and due to “spectral leakage” (a limitation of FFT analysis), a 50 Hz tone will spread across multiple bins.
The Plot Spectrum tool smooths the bins with cubic interpolation, which will give an interpolated peak very close to 50Hz, but the track spectrum view does not interpolate the values, because it would be too slow, resulting in distinct frequency bands. This puts the 50Hz tone into the bin that is centred on 49.4140625Hz.
For better frequency resolution, increase the Window Size in the Spectrogram View settings.
You’re correct, in addition to the “limitations” that I described, there is also a bug.
The bug does not appear to affect “Plot Spectrum”, so perhaps you could use that for your frequency analysis instead.
If you want to log the bug, do so here: GitHub · Where software is built , but be sure to give clear and complete step-by-step instructions to demonstrate the bug.