Dear forum,
this is my first post here, so … nice to meet you (and forgive my English)
I’m trying to understand how audacity peak meter works, and so far these are my knowledges:
the “core” thing is into *Meter::UpdateDisplay(int numChannels, int numFrames, float sampleData)
the formula: average of a window of samples (something like 1/10 seconds of audio data), then 20 * log10 (fabs(average of samples))
Now, let’s take for example a sine wave with a -1.0 / 1.0 range of amplitude and apply the formula 2): the average will be something like 0.6 which means a value of -4.4 dB (values very approximated). This is obviously NOT the maximum. So why Audacity displays correctly a peak in its meter, drawing the bar exactly at 0 dB? Maybe the secret lies into ClipZeroToOne(float) or the strange conversion (db + range) / range, which I can’t understand completely?
Thank you in advance for any suggestion!
<<<So why Audacity displays correctly a peak in its meter, drawing the bar exactly at 0 dB?>>>
That is a mistake. Audacity only meters the top half of the blue waves. Not the bottom. It may have been corrected since I saw this problem.
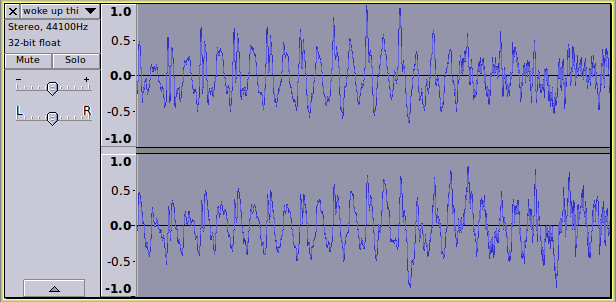
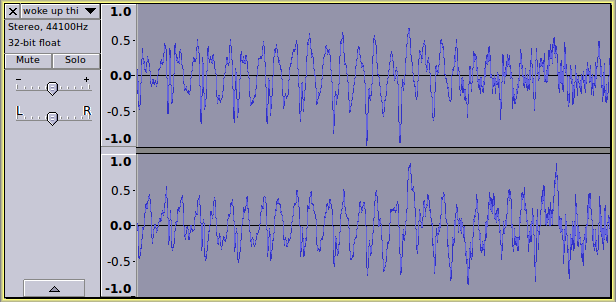
I generated a natural sound test signal with a microphone. I intentionally damaged it by reversing the top and bottom waves. A correct meter would not change, but the Audacity meter did change.
The meters show both peak and RMS values by using two different shades of green (playback meter) or red (recording meter).
The (higher) darker shade is the peak measurement and the lighter shade is the RMS measurement.
In the current version of Audacity, the peak measurement shows positive peaks.
The RMS measurement is displayed correctly in the normal way.
@Koz have you previously raised this issue about the peak meter? Did you get a answer as to whether it is a bug or a feature?
If it’s considered to be a feature, then I think that we need a feature request for the meters to display “absolute peak” (that is, peak positive or negative).
Audacity only meters the top half of the blue waves
Hi Koz, if with “top half” you mean positive values, I think that this is the right way, because you need to know only the absolute value of a sample (modulus). Please correct me if I’m wrong!
Yes, you only need to know the absolute value of a sample (modulus), but that is not what the Peak meters show.
If you look at the waveform on an Audacity track you will notice that the default view has a linear vertical scale in the range +/- 1
A waveform will clip (distort) if the waveform exceeds this range. However, the peak meters only look at the positive values (0 to +1) and ignore the negative values (< 0).
Koz and myself are in agreement that a “peak” value of -1 (minus one) should show on the peak meter as 0dB and I suspect that you are of like mind.
To test this, select part of an audio track and run this code in the “Nyquist Prompt” effect:
(sum 0.5 (scale 0.5 (osc 60)))
This will generate a sine tone that is offset so that it is all in the range of 0 to +1
When you play this track, as expected the peak level is immediately shown in dark green as 0dB and the RMS value (shown in light green) climbs up to -4.3dB
Now run this code:
(sum -0.5 (scale 0.5 (osc 60)))
This will generate a sine tone that is offset the other direction so that it is all in the range of 0 to -1
As expected the RMS level climbs up to -4.3dB, but the peak level is nowhere to be seen because the meter is measuring it as -infinity dB.
Why not just do absolute value before computing it?
Would that slow things down too much while recording?
It should not matter unless there is really bad DC offset.
Recordings should be -24dBFS (-18dbFB if you live dangerously).
So a couple of db on the peak meter is noise.
The peak from Plus values is good enough for govt work.
When editing, the abs value should be used. As that is a batch computation the time to do it should not be a concern.
Suggestions:
Leave it alone for recording.
Fix it (if needed) for fx and batch processing.
I don’t know if it would have much of a performance hit, but I wouldn’t have expected it to. If you write a patch against SVN head I’d be happy to test it.
Waveforms are not necessarily symmetrical even if they have no DC offset, so with some waveforms it will matter.
If you are talking about the peak recording level, then as has been explained to you many times before, -24dBfs is a bit lower than ideal. The Audacity documentation (and most other authoritative texts) recommend that, in most situations, aiming for a peak level of around -6dB is about right. However, this is not the subject being discussed in this topic.
Thank you guys for the detailed explanations and inspirations, now I have a clear picture of this case.
So Audacity takes the maximum value inside a buffer of samples, but only the positive ones (and this seems to be an issue).
I don’t think that something like fabs(x) would slow down the processing, I’m already using it in an ultraraw peak meter and my CPU doesn’t complain.
Yes it appears to do so, but in normal recording practice it would a very rare occurrence for it to be a significant problem.
It is however a little disconcerting that the left channel of this waveform (which HAS been Normalized) meters at very close to 0 dB,
whereas if the waveform is inverted (see below) the same (left) channel meters at around -3 dB
Fortunately the red clipping indicators work with both positive and negative peaks.
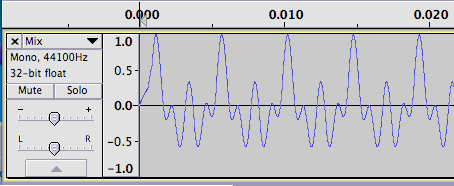
Confirmed on 1.3.13 Nov 7. It’s also fairly easy to generate an asymmetrical wave. Generate tone into three separate mono tracks: 220, 440 and 880 Hz at level 0.2. Slide the 440 and 880 Hz tracks so the first peak lines up with the first peak in the 220 Hz track. Mix and Render.
are we talking instantaneous peak
recent peak
or entire track peak ?
we really need the entire track to avoid clipping.
and we cant know that until after we are done.
while there may be a small time delta where one side of the
wave is larger/smaller than the other, on the average they better
be symmetrical over all or there will be a dc offset.
a priori before knowing the max peak we need to record at
a level that is below the maximum anticipated PLUS leave an
additional margin in case we guess wrong.
my margin, as in at least one international standard is -24.
other standards use -18dBFS
feel free to go as high as you like
as long as you are prepared to go lower when you discover
that you clipped at that level
noobs complaining on bbs forums about problems usually
set their level way too high – often -6 to even 0
Try generating the wave I specified in my previous post. It has no DC offset but is asymmetrical. The light blue wave area is pretty much symmetrical, but the peaks are not. Run the Normalize effect with Remove DC offset checked and Normalize unchecked and it does nothing.
I believe those are transmission standards, leaving adequate headroom for unexpected peaks.
I guess I’m a noob, because when transcribing LPs, I use -6 dB for my setting on the loudest part of the LP. Ticks and pops may clip, but who cares?
Live recording is another matter. I’ve found that -12 dB is usually adequate. But again you have to set your levels during the loudest expected passage.
I quite agree, though if recording unpredictable sound sources (such as very young children) it may be necessary to allow even more headroom (there’s a huge difference in level between a small child burbling and a small child squealing with excitement
However it is also important to be aware that allowing more headroom than is necessary will result in the background noise level to be louder than necessary by an equal degree. So as you say, for best results “set your levels during the loudest expected passage” (including a safety margin just in case).
I’m not sure if you know, but a fix has been committed for this - see bug 259. The fix is in the Win Unicode Nightly, but not yet in the Mac Nightly (will be in the next one after 24 Nov 03:15).
Fix seems to be OK so far on Windows and Linux (reads correct levels also).
quote …
This will generate a sine tone that is offset so that it is all in the range of 0 to +1
When you play this track, as expected the peak level is immediately shown in dark green as 0dB and the RMS value (shown in light green) climbs up to -4.3dB
I would expect the peak to be -6
and a square wave to be at 0dB
and the rms to be -3
clearly I am missing something
(perhaps believing too much of what I read)
on the other hand
there are several standards for measuring peak/rms etc
that give different values for the same signal depending on the method you choose
and some DAWs implement the measurements wrongly to boot
Excellent. I’ve just tried it and it correctly indicates the absolute value of the signal with the dark coloured meter bar, which is in agreement with common practice, (and with the description in Wikipedia. Amplitude - Wikipedia )
Since a peak measurement is not useful for qualifying the noise performance of a system, or measuring the loudness of an audio recording, for instance, RMS measurements are often used instead.
There is a potential for ambiguity when assigning a level on the dBFS scale to a waveform rather than to a specific amplitude, since some choose the reference level so that RMS and peak measurements of a sine wave produce the same number, while others want the RMS and peak values of a square wave to be equal, as they are in typical analog measurements.[3][4][5][6]
For the case in which the RMS value of a full-scale square wave is designated 0 dBFS, all possible dBFS measurements are negative numbers. A sine wave could not exist at a larger RMS value than −3 dBFS without clipping, by this convention.[7] This is the convention used in Euphonix meters.[8]
For the case in which the RMS value of a full-scale sine wave is designated 0 dBFS, a full-scale square wave would be at +3 dBFS.[9][10] This is the definition specified in AES Standard AES17-1998[11] and used in Dorrough meters.[8]