I hope I’m posting this question in the right group. This is my first post. I’m using Audacity 2.2.2 on Windows 10 64-bit. I’m a new Audacity users, so this question has probably been addressed before, but I could not find it in the FAQ. I am comfortable with signal processing/filtering, but I’m still learning the details of Audacity.
After making a selection of data in the time window, then selecting Analyze/Plot Spectrum, is the time window that is used for the spectrum calculation limited to, or trucated to the interval [start_time → Size/ProjectRate]? For example, if I select an entire project of 7 seconds with a project rate of 44.1kHz; then after running Analyze/Plot Spectrum, and setting the Spectrum “Size” to 65536, is the time window that is used for the spectrum calculation [0 → 1.486] seconds?
I just want to make sure my interpretation is correct. For a project rate of 44.1kHz, with a fixed start_time, selecting a time window wider/greater than 1.486 seconds offers no benefit as it should not change the resulting spectrum (with a fixed size of 65536). There might be some numeric pixel changes as the image is updated, but the resulting spectrum should be the same. And the frequency resolution of a project with a 44.1kHz project rate has a minimum value of 0.672913 Hz (44100/65536).
I’ve checked this by comparing exported spectrum, but I just wanted to confirm my interpretation.
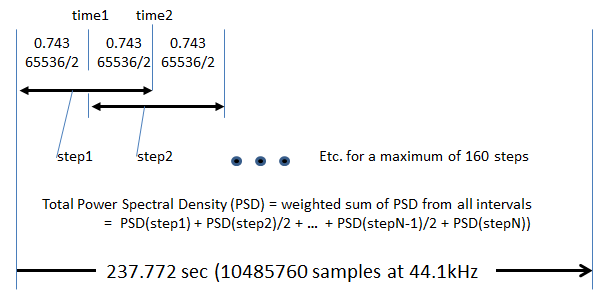
The selection is analyzed in steps of “Size / 2” (50% overlap of the windows), up to a maximum of 10485760 samples, or the end of the selection (whichever comes first).
If multiple tracks are selected, the audio data in the tracks is mixed in RAM prior to the analysis.
The (dB) levels in the spectrogram are normalized such that a 0 dB sine wave is displayed with a level of 0 dB.
Thanks for the reply. I think I understand. So the individual time segments are analyzed (by calculating the FFT), and the magnitudes of the results are then added in the frequency domain, using a weighting to account for the overlapped segments and the end pieces? I wonder how Windowing method affects the results. This is likely a power spectral density with no phase information (just the magnitude of the FFT), I guess you can just add the amplitudes. Probabably a lot quicker to add up 160, 65536 point FFT’s, rather than to try and calculate one 10,485,760 point FFT.
I’ve attached an image (below) that attempts to show this for a 44.1kHz project rate to see if I am following the explanation. If you know where this is implemented in the GitHub source, please point me to it and I’ll take a look. This will make it easier to understand the spectrum and how to use it for filtering.