Hello everyone. Firstly, I’d like to point out that this sort of thing is rather new to me, so if I’m not clear enough or I’ve posted in the wrong section or something else, sorry about that. Also, this isn’t necessarily an Audacity question, but Audacity seems to have come to closest to giving me a solution, and also I figured someone here was likely to know.
What I’m trying to do is create a basic visualisation for an animation, for this I need some way of interpreting the accompanying music. Whether it’s the frequencies, decibels, or something else, I just need some way of getting a textual output of a piece of audio, preferably with a timestamp at each piece of data.
I don’t mind what method or program I need to use to get this data. I hope someone knows what I’m talking about, and credit to them if they do, because I’m not even sure if I do. Either way, a pointing in the right direction at the very least would be very much appreciated.
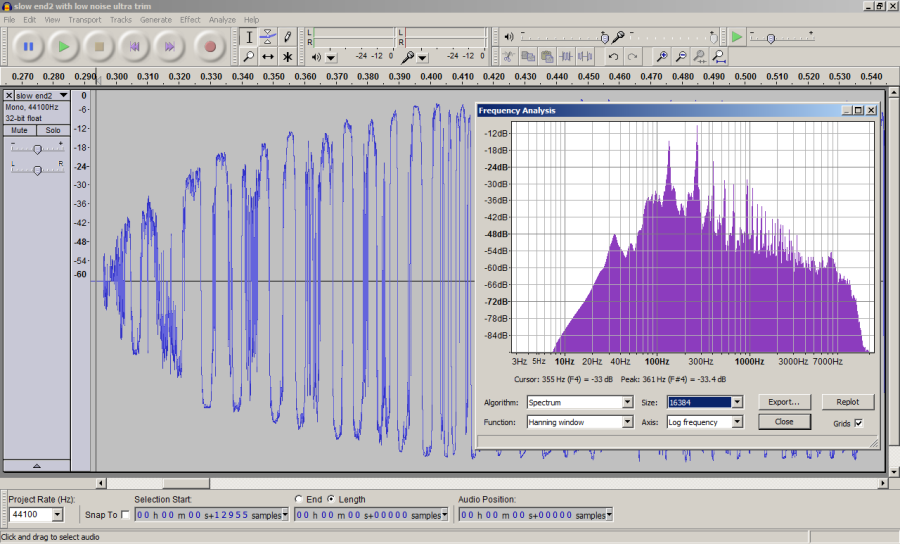
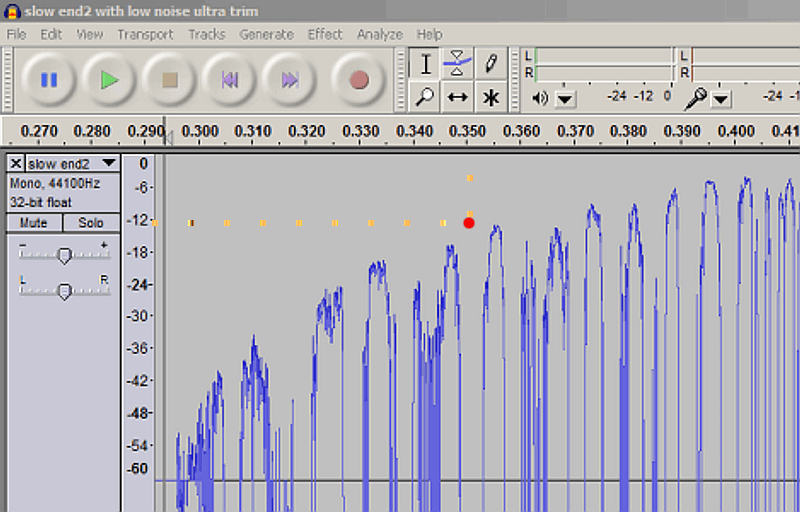
I don’t understand ’ textual* ’ if you mean graphical Audacity will show frequency analysis graphs and show the waveform in decibels …
[* Audacity won’t transcribe sound in to a musical score].
BTW if you are animating these links may be of use …
I’ve never seen such a thing, but it may be possible to automatically generate a text file listing the the amplitude of the envelope at different times, via a custom-made plug-in. Steve’s your man for that nyquist plug-in stuff.
There’s a lot of different things that you could do, but outputting the “amplitude” (dB) is probably the easiest. (outputting frequency data is very much harder).
That looks very “do-able”, particularly if you don’t mind doing a bit of manual “copy and paste”.
I would suggest that you analyse a mono track rather than stereo. Processing mono is easier to do and the output will be easier to interpret.
If you currently have stereo tracks, Audacity 1.3.13 can convert them to mono using “Tracks menu > Stereo track to mono”.
If you do not currently have Audacity 1.3.13, you can get it from here: Audacity ® | Downloads
I’ll knock up a bit of code that you can use in the “Nyquist Prompt” effect, but I’ll be writing it using Audacity 1.3.13 so there’s no guarantee that it’ll work in earlier versions of Audacity.
Try running this in the Nyquist Prompt effect.
Open Audacity and import your mono audio file.
If the file is not mono, convert it to mono.
With the track selected, select “Nyquist Prompt” from the Effect menu.
Copy and paste this code into the Nyquist Prompt window.
Click on the “Debug” button to run this effect.
The output will be in the “debug window” which you will then be able to copy and paste into a document of your choice.
Important Note:
As with other Nyquist effects, the calculations are performed in RAM. This means that the selected track must be loaded into the computer memory. If your computer does not have much spare memory then large track selections will be extremely slow and may even crash. Memory usage will normally be about 10 MB for each 1 minute of track selection. To process a 10 minute mono track at CD quality requires that you have at least 100 MB free memory.
(setq rate 2)
;;The first line sets how frequently the amplitude will be measured.
;;The number '2' indicates that there will be two readings per second.
;;For 1 reading per second the line needs to be (setq rate 1)

(setq output "") ; initialise output string
(setq rate (float rate)) ; force rate to float value
(setq *float-format* "%#1.2f") ; output text to 2 decimal places
(let* ((stepsize (round (/ *sound-srate* rate)))
         (sdata (snd-avg s stepsize stepsize op-peak))) ; low sample rate sound data
   ; step through samples and end when no more samples
   (do ((count 1 (1+ count)) (val (snd-fetch sdata) (setq val (snd-fetch sdata))))
      ((not val) output)
      (setq val (linear-to-db val))
      (setq valstring (format nil "~a sec: ~a dB~%" (/ count rate) val))
      (setq output (strcat output valstring))))
(format T "Peak amplitude at intervals of ~a seconds.~%~%~aEnd of selection." (/ rate) output)
(format nil "Click OK for results.nIf no results show, run again and use 'Debug' button.")
I’m not ashamed to say that I’m basically in love with you right now. Platonically, of course.
But seriously, it seems to work beautifully, thank you so much.
While not vital, as 0.5 second increments seems to be ideal right now, in case in the future I need to change it, is there a variable in there I can alter to change the time interval?
Half a second is a long time in animation: there could be a very loud brief sound, say a gunshot, between the half second sample points.
If so there would be no indication of the loud gunshot sound on the list.