So this may be a really stupid question but here goes:
My friend has edited some audio files I have sent him with Audition (I know Audition and Audacity are two completely separate beasts!). When he has edited them he has shown me, like a heatmap? I don’t know the best way to describe it but he sort of sees on a colour spectrum basis where bits are he needs to fix. Is there anything like that I can use in Audacity or is it looking out for the peaks as I have been doing?
Sure. Drop-down menu on the left of the timeline > Spectrogram. The regular display is “waveform.”
Let’s see. I don’t use this one very often. Time is left to right, pitch is up and down and volume is color (or colour).
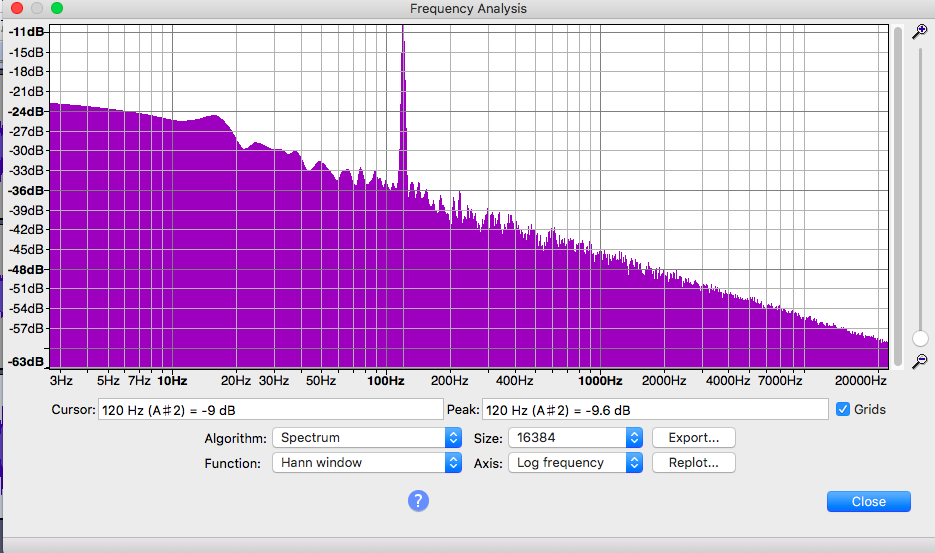
Another way to look at the same thing is Analyze > Plot Spectrum. That one doesn’t have time. Whatever you select in the show is what you analyze.
It’s louder up, frequency or pitch left to right, high pitch to the right.
This, for example, is kind of a mess.
That’s actually very specific things, but you’ll never figure it out from the waveform.
Spectrogram isn’t helping any.
But Analyze > Plot Spectrum turns into plain hissy pink noise with a 120Hz tone or spike. That’s handy to know because 120Hz is a common interference or hum from the wall power in the US.
It does taking getting used to.
So, just checking (and am guessing there might be a YT video to help?), in Analyse - Plot spectrum, if I pop the mic or tut, can I just highlight that one bit and drag it down a bit?
I’m still having trouble just altering those specific pops or fixing the audio - is there anything else I can try? (To lessen the effects of things that shouldn’t be there)