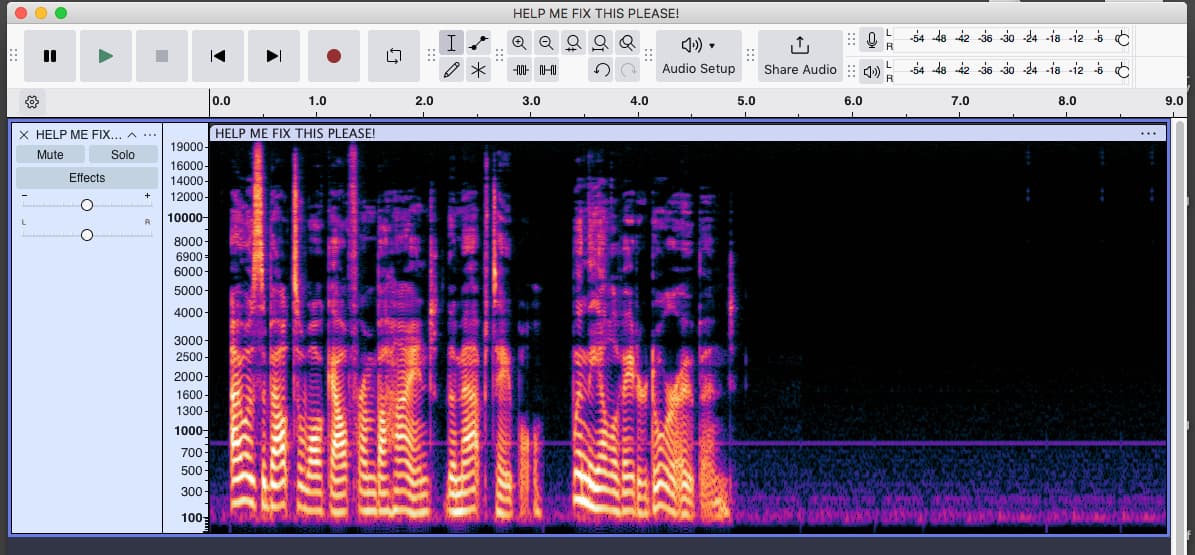
I created a notch filter at 830Hz based on a completely lucky guess. I blew up my screen as tall as it would go. It worked. How was I supposed to make the display tell me where that line was in frequency?
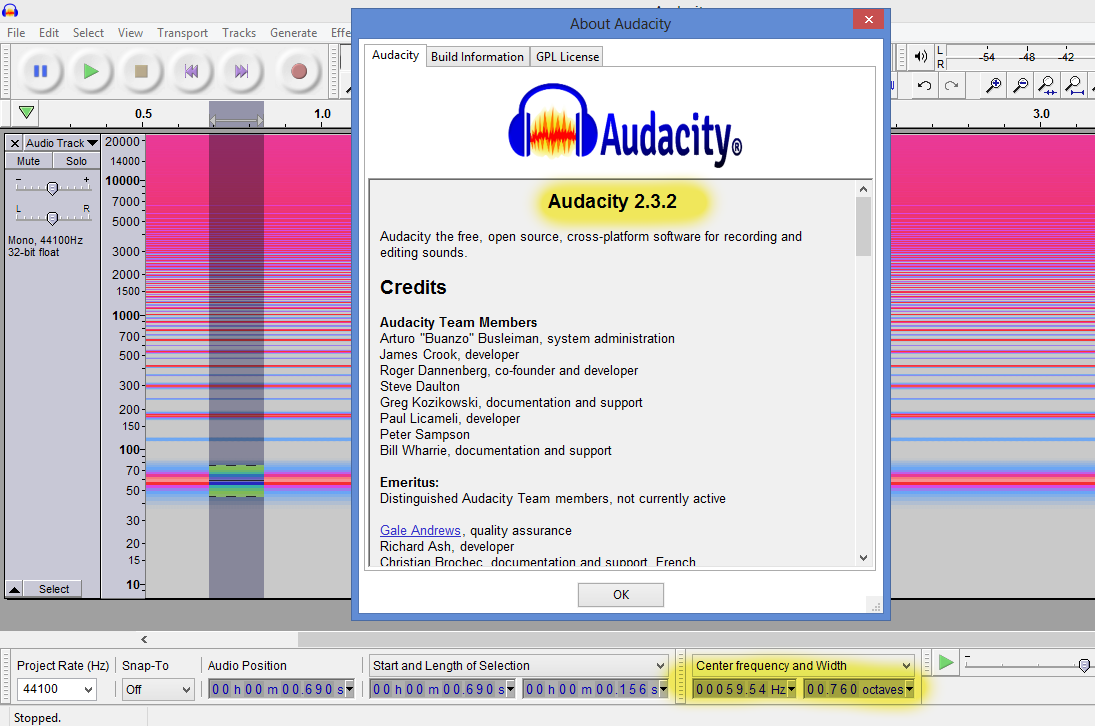
For a more accurate indication, a better tool is Plot Spectrum. Select a part that is mostly silent apart from the unwanted “tone”, and you should see a spike at that frequency. Increase the “Size” parameter to increase frequency resolution, and use the mouse to select the peak.
The Plot Spectrum tool in the Analyze menu will also help you find the frequency to apply the Notch filter to. When in the Plot Spectrum window, move the mouse cursor over the peak and it will tell you the exact frequency.
Yes. If you can see it. In this case, the 816Hz tone was pure enough to vanish if the Plot Spectrum Size setting is too high. The display is smaller than the pixel count of my screen. In this case, I did it backwards. I kept increasing the graphic size of the Spectrogram Window until I could get into the ballpark. Then open Plot Spectrum and decrease the Size (accuracy) until the tone appeared.
Again in this instance, the original guess of 830Hz caused the bad sound to decrease substantially and the following gentle Noise Reduction of the Beast resulted in an acceptable presentation.