Hi! So I was conducting this expeirment where I placed a buzzer at the end of a ruler and made it rotate with uniform circular motion using a spinning fan connected to a power supply. I recorded the audio using Audacity 2.2.0. The purpose of the experiment was basically to see how observed frequency of the source as it moves towards and away from the receiver (my laptop’s microphone) changes.
There was this site I used as reference: http://www.animations.physics.unsw.edu.au/labs/Doppler/doppler_lab.html
It has a sample audio for a similar recording and the physics of the experiment (Doppler effect in circular motion). It also has a spectrum that was generated using audion, showing a pink wavy line representative of the change in frequency.
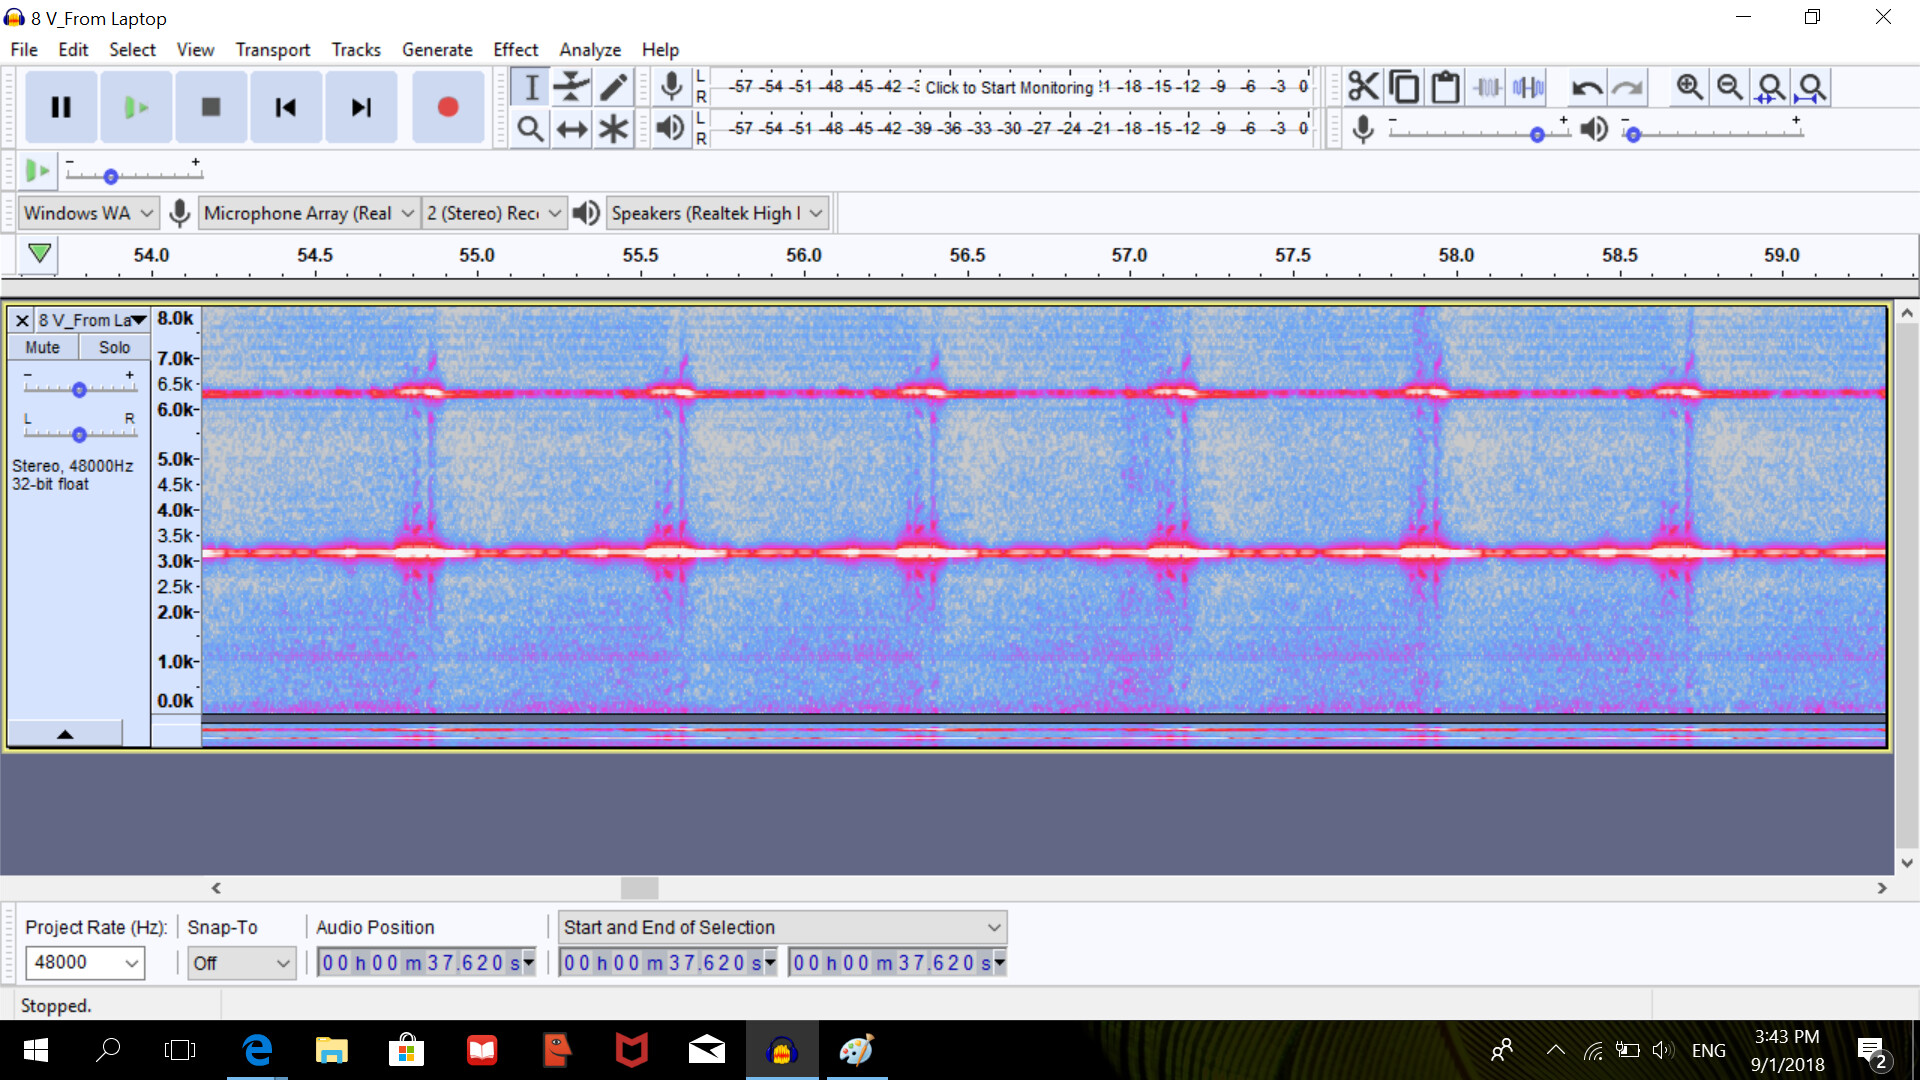
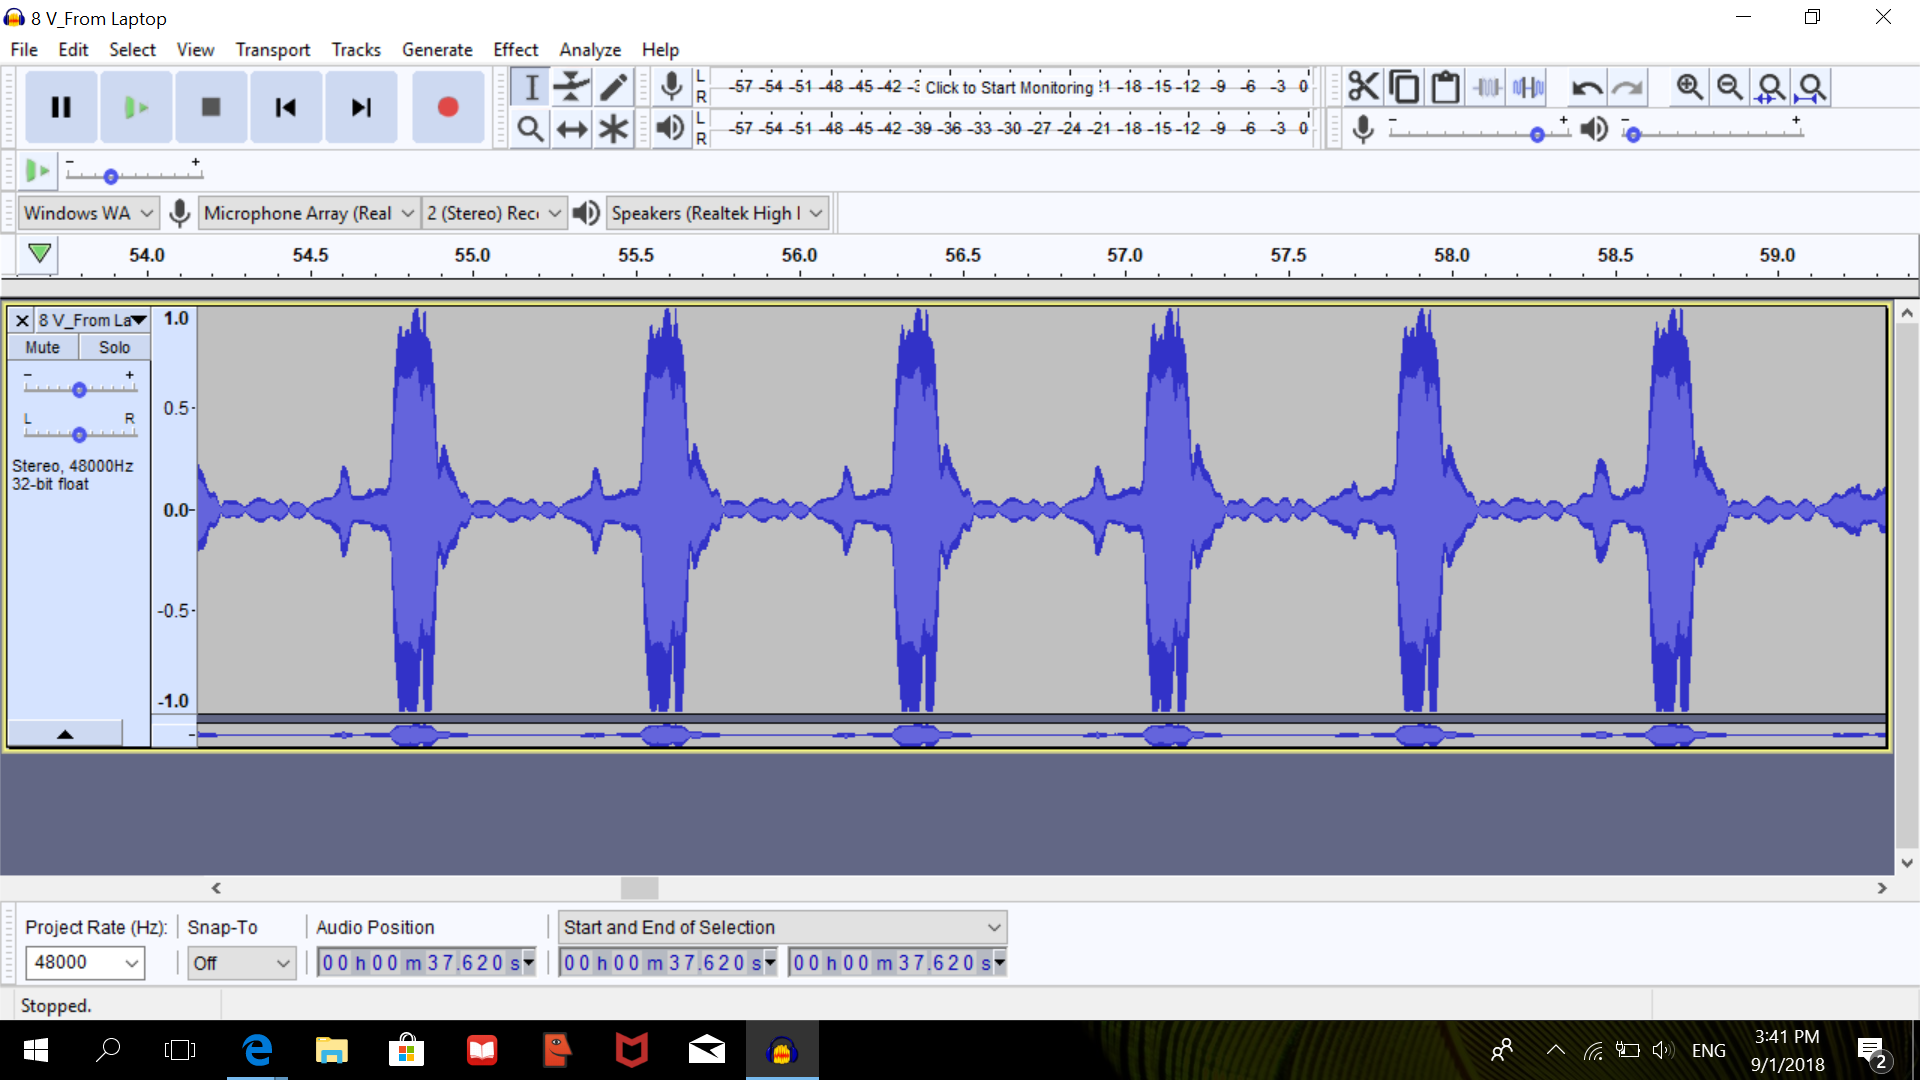
While I did something similar, i did not get any observable trend as the one on the site did. In fact, I am not able to make out whether frequency is even changing or not. I have attached the audio and two screenshots of the data collected (Volume VS Time and Frequency VS Time). Can someone help pinpoint what exactly I am doing wrong in comparison to the website? And is the frequncy changing or constant? Also why does the sound and frequency go below and above an axis? And I know the white thing means high volume, but is it showing any trend (nothing is dicsernible to me though)?
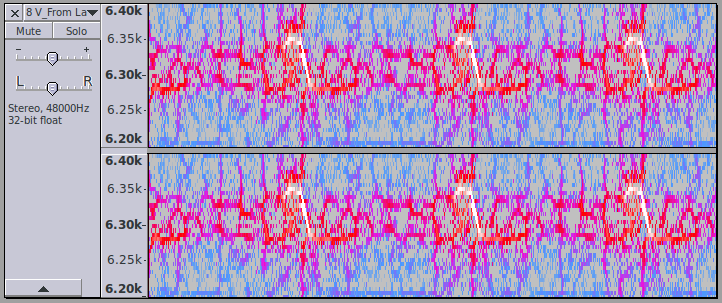
I get this:
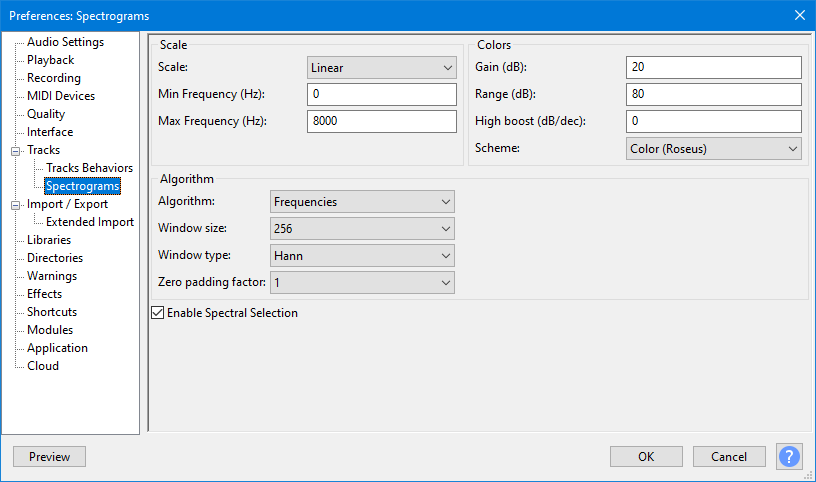
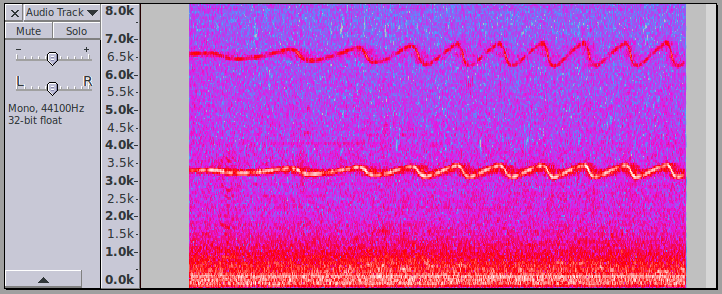
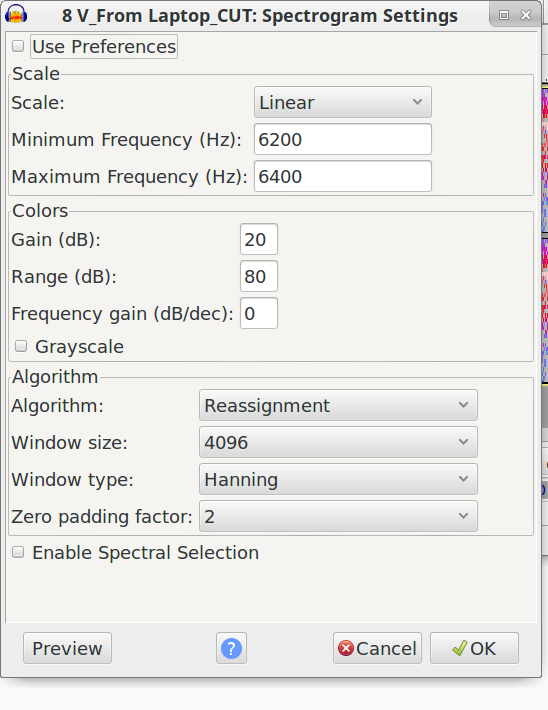
The effect is much more subtle with your recording, because the the rotational circle is much smaller, so the speed change is much less, but the Doppler effect can still be seen with these settings: Note that these setting will be very slow because they require a lot of processing.
Thank You So Much! @steve. I followed the settings you put on audacity and it worked out. I too was suspecting the radius to be a problem, but I coudn’t fix that as the spinning fan is unable to move a bigger ruler (too heavy). I had a few more doubts on why it worked with these settings:
I think the zero padding 2 made all the difference because I had experimented with the window size of 4096 previously. How does padding affect the original spectrogram?
There are two distinct lines in the original pic I had posted (one at 3.1 or 3.2 K…and the other close to 6.3 K). How did u decide on picking the 6.3 K one (even on that site I had mentioned in previous post, they picked the one with the higher frequency even though a similar curve occured at the bottom)?
What effect does window type of reassignment have? Is it more…accurate in terms of showing the white line (the loudest sound the laptop picks up)?
FFT analysis always has to compromise between frequency resolution and time resolution. A larger window size will improve the frequency resolution, but at the expense of blurring the time resolution. A smaller FFT window size will give better time resolution, but at the expense of reduced frequency resolution.
Zero padding has a similar effect to increasing the window size but without the cost of blurring in the time domain. Zero padding tends to be most effective when using a small window size. It does not actually improve the “resolution” in the frequency domain, but it does help to make the most of the resolution that is available by improving the discrimination between adjacent frequency bands. It sort of “tighten up the picture” (at the expense of slower processing).
Probably the biggest improvement in this use case comes from the “reassignment” algorithm. This is quite a complicated (and slow) algorithm, and is described in this Wikipedia article: Reassignment method - Wikipedia The basic idea is that it acts as a kind of “sharpening filter” that estimates localized values based on the surrounding data. The down side is that it can create the illusion of patterns that don’t actually exist (as seen by the red and blue “veins” in the final image, but the plus side is that it can pull out details as shown by the white (highest intensity) regions.
FFT analysis splits the overall frequency range into a large number of frequency bands of equal width, measured in Hz. The width (in Hz) depends on the window size. The larger the window, the narrower each frequency band (hence better frequency resolution).
Pitch, and variation in pitch is a matter of “ratio”. A one octave range in pitch is a ratio of 2:1. One semitone range in pitch is (approximately) a ratio of 1:1.0595.
The Doppler shift is a shift in pitch - it’s a ratio.
The ramification of this is that FFT analysis gives better “pitch” resolution for higher frequencies than for lower frequencies. Thus the higher harmonic of the sound can be viewed with better pitch resolution than the lower “fundamental” tone.
ahh yes yes…the doppler shift is a ratio of the frequencies. So to clarify, the two frequencies are - the fundamental one (is this the actual frequency of the sound source???) and the one at a different octave (which still gives same frequency ration representative of doppler shift)? Also why is pitch resolution better when it is higher…is it just the way FFT works?
The only sound that is a single frequency is a “sine wave”. All other sounds are comprised of many frequencies. Often the dominant frequencies are harmonically related (exact multiples)
If you look at “Analyze menu > Plot Spectrum” with your sound, you will see peaks at about 3.16, 6.33, 9.51. 12.66 … kHz, where 3.16 kHz is the “fundamental” (base) frequency, and the harmonics are at 2x, 3x, 4x… that base frequency. The Doppler shift will affect all of the harmonic in the same way (the same ratio shift), so it doesn’t really matter which one you choose - you’re just looking for one that will give a clear image in the spectrogram view.
As I wrote previously, FFT splits the spectrum into equal divisions (in Hz), so let us say, as an example, that our chosen settings give frequency bands of:
0 to 10Hz, 10 to 20, 20 to 30, 30 to 40 …
Now let’s look at octaves, starting from 10 Hz. Each octave has a ratio of 2:1, so the octaves starting from 10 Hz are:
10, 20, 40, 80, 160 …
So quite clearly we can see that for higher octave, there will be many more FFT frequency bands than for low octaves. A large number of frequency bands means that we get better frequency resolution.
Yes, that clarified it. I though harmonics and fundamental frequency were only concepts for standing waves and not any regular sound source (and for standing waves it is not just integer multiples by even multiplying with 2/3 or 4/3 depending on the way the standing wave is created). So, like how there is a logic to find the general formula for harmonics in a standing wave (based on node antinode etc.)…is there any for a sound source with various frequencies (or it is purely dependent on the type of sound source?)
Also, with regards to the pitch being higher, FFT bases its divisions of the frequency band on the octave and not the width of the frequency band? (Since it is same for 10-20 or 20-30 etc.)
If you look at “Analyze menu > Plot Spectrum” with your sound, you will see peaks at about 3.16, 6.33, 9.51. 12.66 … kHz
You mentioned about finding the values of frequency peaks using plot spectrum…but they are just approximations right? How to get the exact values of the max and min frequencies?
Hi!
So, I exported the data that gives me the exact values of the frequency peaks…but I had the following problems:
The maximum frequency as indicated by the exported data did not match what was shown on the sepctrogram graph. For the same audio I had put on the forum, the max frequency as indicated by the spectrogram seems to be slightly over 6350 Hz, but when I export the data (i have attached below), isn’t the max frequency being shown as 6328.125000 (that is the lowest dB which is indicated by a peak?..correct me if I am wrong)
I am unable to locate the minimum frequency. All I am able to speculate from the graph is that it must be around 6270 to 6280 Hz. But from FFT analysis, I am not able to discern the min frequency.
What would be the uncertainty for the frequency values? Since it has 6 decimal places, I intially thought it would be ± 0.000001, but later I noticed that all the frequency values always had 0 in the last 3 decimal places, and as for the first three decimal places, they always were multiples of 125…like XXXX.125 or XXXX.750…or XXXX.375…so would the uncertainty be something else…perhaps ±0.125/2 (like least count divided by 2) = ±0.0625 Hz?
The “Size” setting that you are using with the sample rate of your audio is giving you an analysis of frequencies at intervals of 46.875 Hz.
Other than that, I can’t work out what you are asking.