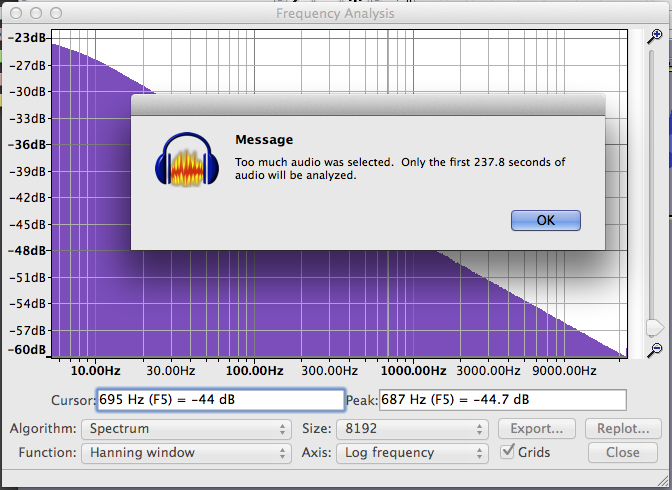
I’m using the plot spectrum function to analyze white noise recordings, as a control, to make sure our audio system is the same all the time. My problem is when I play the white noise and plot it out, then do it again, the numbers don’t match. They can be off as much as 3dB even though it is the exact same audio. I don’t even have to record; I can just play it, then plot it, then play it again, then plot it again…and I still get different numbers off as much as 3dB. How is that happening and how can I fix it?
I’ve set the record preferences to start recording when it hears -20dB. I’ve tried different dB’s here but it does not matter. I’ve tried stopping it manually or stopping it at a certain timestamp with the same results. It is always off by as much as 3dB.
So you are not analyzing “the exact same audio” each time.
You are analyzing different recordings of similar white noise.
“White Noise” is by definition “random”, so unless you are analyzing a very long section, there will be significant variation in narrow band amplitude over time.
It is the same exact white noise file. If it starts recording at the same time and stops at the same time, therefore it should be the exact same section of the file with the same output…right?
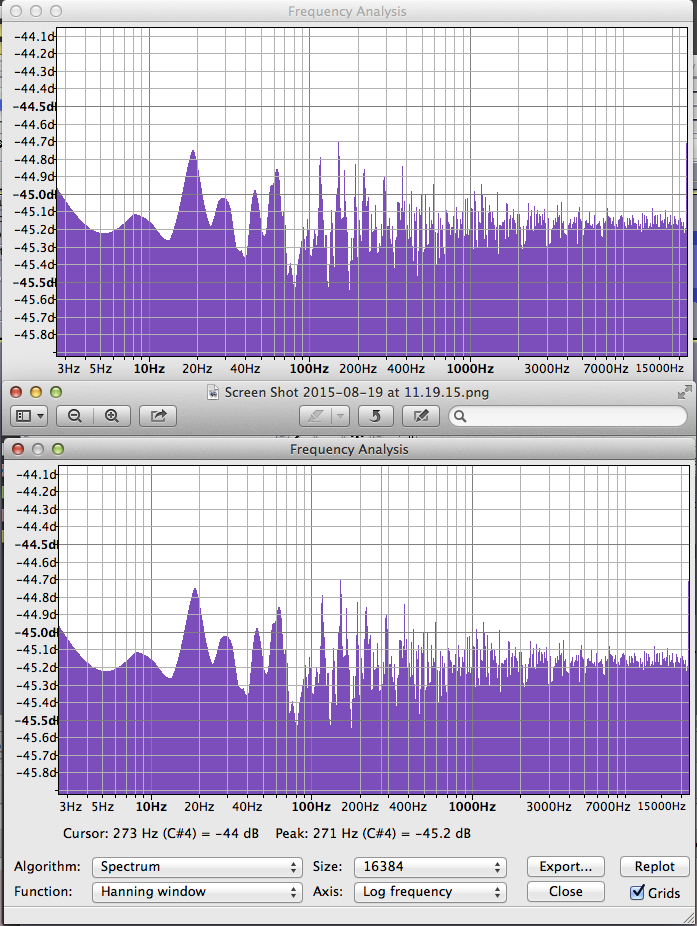
It is only about 5 seconds of audio. Also I’ve set the size to 4096. I export the output to a text file which I convert to an excel spreadsheet. The numbers in the spreadsheet do not match each other…again, off by as much as 3dB.
No. How do I reproduce the problem with that file (White Noise1.wav) that you posted?
You mean that you repeat steps 1 to 6?
But that is not the same audio. It’s a new recording and there is no reason why it should be identical to the first.
It seems that what you are saying is that there is more difference between the spectrum plots of “identical sounding” audio than you would expect.
Look at it this way. The average height of an American is 1.75m.
Let’s say that you went down to a busy train station on a Wednesday afternoon, grabbed the first person that you saw, and measured them. Let’s say that they were 1.73m tall.
You go out the next day to the same train station, do exactly the same thing, but this time the person is 1.80m tall. Does this mean that people are taller on Thursdays? Does it mean that everyone is getting bigger? Does it mean that there is something wrong with the tape measure? No, it is just natural variability. We know that the average height is 1.73 meters for Americans, just as we know the average amplitude for a specific frequency band of white noise, but there is natural variability, If you measured enough Americans and took the average, you would probably find that the average measurement was about 1.75m. Similarly, if you take lots of measurements of white noise you will probably find that the average is close to the expected value.
Since it is the exact same audio file recorded at the exacts same section, I should get the same numbers. I’m not using different files or a different section of the same file. I’m not taking averages of different files as your illustration would imply.
Analog sound is not exact. There is no way to make “the exact same recording” unless it is entirely in the digital domain.
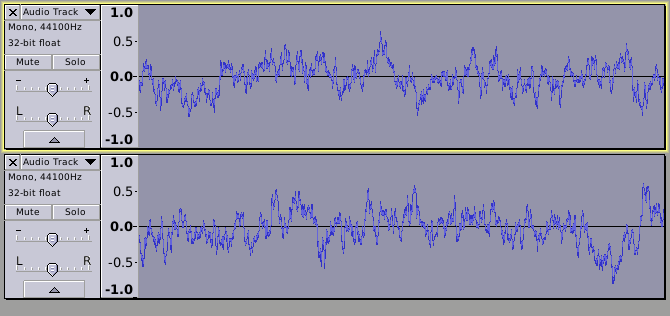
If you import two of your recordings and zoom in really close, you will see that they look quite different.
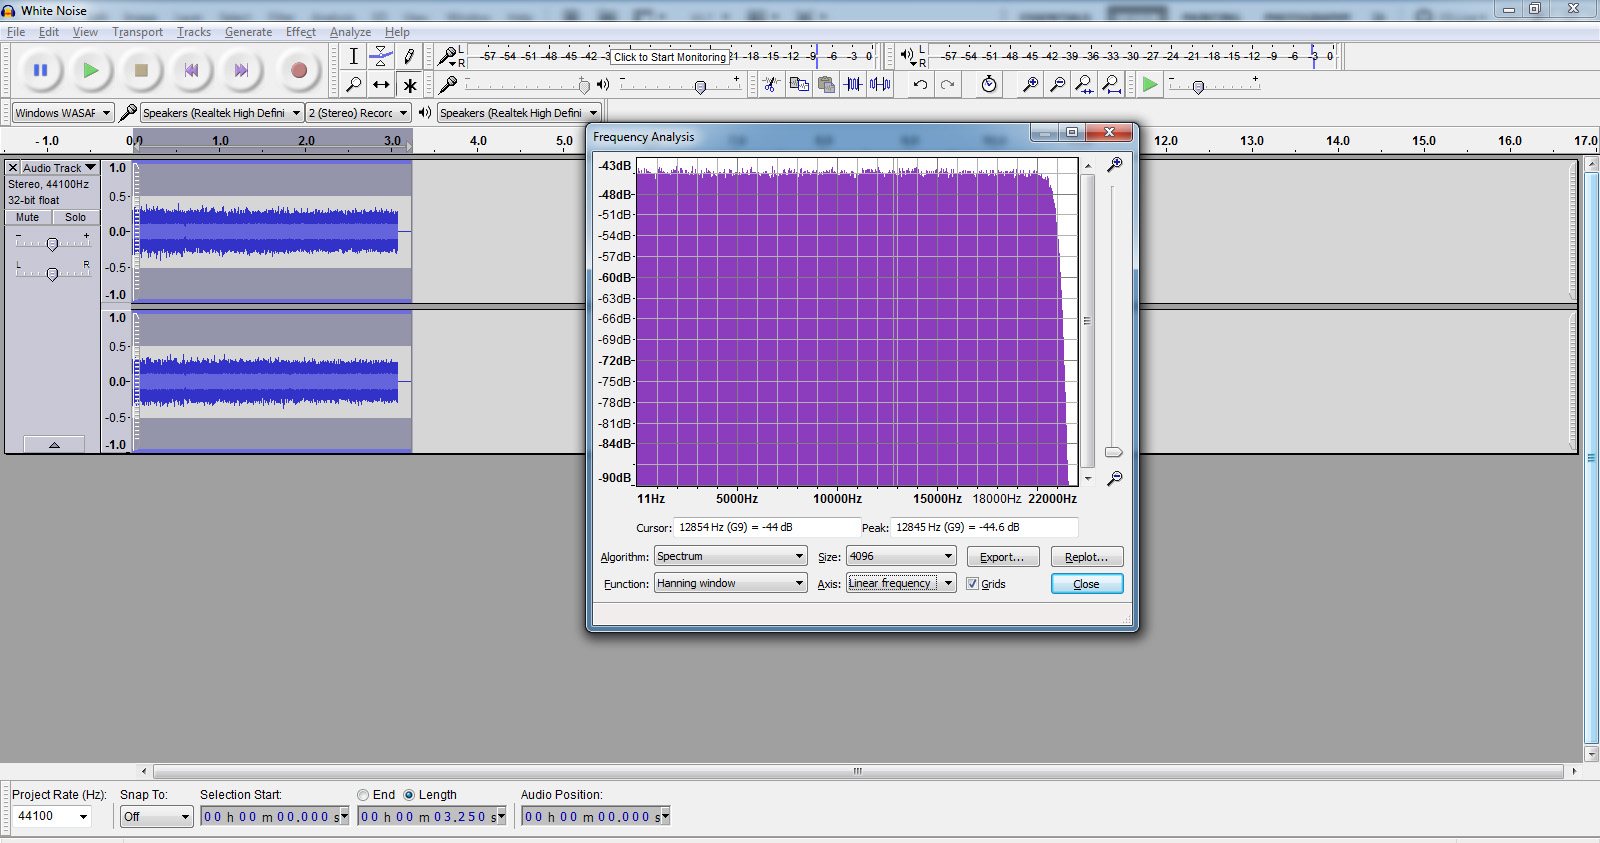
When I import the file “White Noise1.wav” and analyze it with Plot Spectrum, I get the exact same results every time. Do you?
If so, then Audacity is working correctly. If not, please tell me how you do it.
I’m playing it with Windows Media Player and recording it with Audacity like I said in the steps I gave. I should be able to play it over and over and record it over and over with the exact same recording output, right?