Hi,
I am using Audacity 2.2.2 on a Windows 10 x64.
For a science project, I need to record a particular sound (the buffetting sound air makes when a car drives at a fast speed, window open) .
To do so, I use a TASCAM DR-05. Then I analyse the file with Audacity in order to plot a graph showing the sound volume of each frequency.
But when using the ‘Plot Spectrum’ option, the lowest frequency is about 47Hz. What I need to analyse is at about 15-25Hz.
How do I show low frenquencies (and maybe crop high frequencies to make it easier to read) ?
Moreover, the sound volume axis is odd. What I should find is something between 100-135dB but everything is negative. From what I understood from other threads, 0 is the highest sound volume, but do I need to add a flat value then ? How do I get the sound volume ?
What I should find is something between 100-135dB
You left pieces out. “What I should find is … 135dBSPL.” Sound Pressure Level. Not audio sound level. SPL does go in positive numbers.
You also need to specify which dBSPL. There are a bunch of weighing specs. The one used for Health and Safety measurements isn’t flat across the audible spectrum.
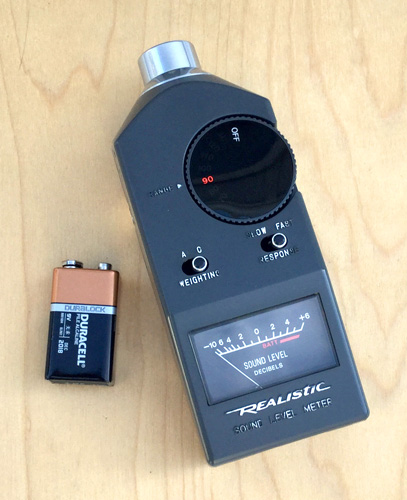
So you have the wrong meter. You need a Sound Pressure Level meter with the weighing settings you want.
This one will do A and C weighing.
There’s no convenient direct conversion between SPL and what the TASCAM is doing.
Koz
This meter has a socket on the side so you can send the sound to a recorder. That’s when you get your spectrum plot.
Analyze > Plot Spectrum has no zoom or crop features. The best you can do is grab the corner of the display and pull to get better resolution. The “Size” setting increases “sharpness” of the display. You don’t always want the highest setting because you could have a display that’s so sharp you can’t see it.
Plot Spectrum tends to display everything it can find and you can’t set it. This makes matching two different spectrums a challenge.
The Tascam has a high-pass (rumble) filter for field spoken-word recordings. Make sure it’s turned off.
Koz
Thanks a lot for your response.
First, sorry for the doublepost. I saw the Read Me later and wanted to make a new, more detailed post and delete the other one, but didn’t find out how.
I haven’t yet studied the notion of SPL (next year) , and I got confused, mixing everything up and buying the wrong meter.
I read a little about it now.
• I don’t know which weighting I should use.
My project focuses on the sound the air makes when a car is driving with one (or more) window open. It aims to determine in which conditions this sound will be too loud (as it becomes painful and disturbing) .
My project also has a second part where I’ll have to make a theoretical modelization.
Considering this, which weighting should I use according to you ? And is it very impactful ?
• Do you mean that I’ll need to plug the SPL meter to the Tascam (or a PC) , from which I can directly get a spectrum plot, not using Audacity ?
• Finally, do usual SPL meters I can find online measure frequencies around 10-30 Hz ? And from what I can find, most of them go up to 130dB, but I might have to measure sounds a few decibels louder. Will it be a problem ?
Someone told me that with better quality meters you can change the sensitivity, or simply wrap it in foam for cheaper meters.
Moreover, the sound volume axis is odd. What I should find is something between 100-135dB but everything is negative. From what I understood from other threads, 0 is the highest sound volume, but do I need to add a flat value then ? How do I get the sound volume ?
There is a direct correlation between the digital level and the acoustic level, but it’s uncalibrated and unknown. Plus, there is usually a recording level control and that affects the recorded digital level. But, if the acoustic SPL level goes up by 3dB the digital level will go up by 3dB so it can be calibrated (if you don’t touch the recording level control after calibrating.) You’ll need an SPL meter to make the calibration. (Use a constant test-tone to calibrate, measure the SPL and record, then check the recorded digital level in Audacity.)
The 0dB SPL (acoustic Sound Pressure Level) reference is approximately the quietest sound that can be heard and dB SPL numbers are positive. The digital reference is 0dBFS (zero decibels full scale) which is the digital maximum* so the digital dB levels are normally negative.
Note that SPL is usually [u]weighted[/u] to match the sensitivity of human hearing at different frequencies.
\
- 0dBFS is the “highest you can count” with 16-bit or 24-bit integers, or whatever bit-depth you are using. Everything is scaled so a 0dB 24-bit file is no louder than a 0dB 8-bit file. Analog-to-digital converters, digital-to-analog converters, regular WAV files, and CDs, etc. are all hard-limited to 0dB. Audacity uses floating-point “internally” so it can go over 0dBFS.
(as it becomes painful and disturbing) .
That’s “A”. “A” is the one used for Health and Safety. That’s the one that hurts and over a time can cause actual damage.
“A” ignores thunder, trucks going by and bat conversations. “A” concerns itself with Baby Screaming on a Jet for one well-known example.
That’s why you can travel at speed in a car on the freeway with windows open and the pounding doesn’t seem to bother you all that much. Most of it is too low pitched to cause actual harm (even though it’s not a good idea). Scene shifts to a saw mill with a five foot blade blasting its way through oak. That will make your ears ring for two weeks.
You can do relative measurements. Set the Tascam for one recording volume and keep it there no matter what. You’ll have to arrange the loudest sound to not overload. The Tascam works at “Z” weighing if you’re keeping track.
Slate each sound. “This is Thursday and we’re testing an Austin Martin at 60 MPH with the windows open.”
Use can use the Tascam measurements as they are and just tell everybody this measurement is 3dB lower than that. Don’t mention Sound Pressure Level.
After you Export all the tests as WAV (Microsoft) 16-bit (Do not use Audacity Projects for this) open a copy and Effect >Equalization the sound down to “A”. Remember that’s the one that measures pain. You’ll have to make up the curve manually by viewing the specifications in Google.
I don’t think there is a pre-baked “A” curve or filter for Audacity.
Don’t put a towel over the meter. That’s the desperation method of recording an interview in a wind, not for measuring anything.
Koz