The Frequency Analyzis is a great tool, but I feel that it lacks an edge of precision when it comes to analyzing peaks in detail. I am aware that changing the axis to a log frequency will zoom in on the lower range of the spectrum, but this is not really sufficient – especially not in the high-end range. I believe this aspect could be improved, if there was a feature that would enable the user to zoom in on a selected area and scroll across the spectrum.
You can simulate increased accuracy with the Window Feature. As you drag the analyze window bigger and bigger, the accuracy of the display goes up. You’re not limited to the size of your screen. You can push the display partially off the screen and then drag it bigger again, multiple times. With the window effectively four feet wide, the accuracy of the display can be considerable. Koz
@kozikowski - It’s not that easy, especially in Windows 7. W7 has a “feature” that either maximizes or half-screens a window as you approach an edge; and even when I was very careful, I couldn’t get the window to be much bigger than my screen (my resolution is 1366 wide, I estimate the window only got to 1380). It just stops stretching at that point.
I have a new Mac program that does that. Very annoying. Koz
I am aware the window can be resized, but I don’t really find this sufficient. Besides, it’s a rather retarding way of achieving something that could be done with a single mouse click. And even if the window is stretched out, the spectrum cannot view a range of one Hz per pixel, which I find a necessity for determining relations between peaks. For instance, I would like to be able to calculate the offset of a peak from its desired position, by counting the steps per Hz with my cursor. This would also make it easier to determine the median for a peak of an instrument with vibrato. Also, in some cases the locked peak values may differ from what the graph appears to indicate, in which case zooming in on those peaks would provide a more accurate view.
The process of analyzing frequencies really is just as essential as it is to be able to zoom in on the actual waveform, and I feel that this tool – also being the only one of its kind that I know of – deserves an upgrade for better usage and improved accuracy. It has everything to do with audio, and it’s also an essential tool in my workflow.
Just my heads up for a simple feature that would make Audacity all the better…
The accuracy of FFT analysis has more to do with the FFT size than the zoom level.
Plot Spectrum in Audacity can use FFT sizes ranging from 128 samples up to 16384 samples. Larger FFT sizes give greater resolution in the frequency domain and smaller FFT sizes give greater resolution in the time domain. For examining the average frequency of a continuous tone, a large FFT size is desirable. For examining the frequency at a specific place, a small FFT size is desirable. At 44.1 kHz, an FFT size of 16384 samples is about 0.4 seconds and this gives a frequency resolution of about 3 Hz, but note that this is based on an overlapping window function.
As an example, these are the actual FFT frequency measurements from a 1003.5 Hz sine wave using an FFT size of 16384:
Frequency (Hz) | Amplitude (dB)
0987.835693 | -71.967911
0990.527344 | -68.049019
0993.218994 | -65.021118
0995.910645 | -59.583153
0998.602295 | -18.285622
1001.293945 | -4.931305
1003.985596 | -2.080265
1006.677246 | -8.303660
1009.368896 | -27.233620
1012.060547 | -71.773621
1014.752197 | -65.790184
By placing the mouse pointer over the Plot Spectrum window, the interface shows the peak to be 1004 Hz
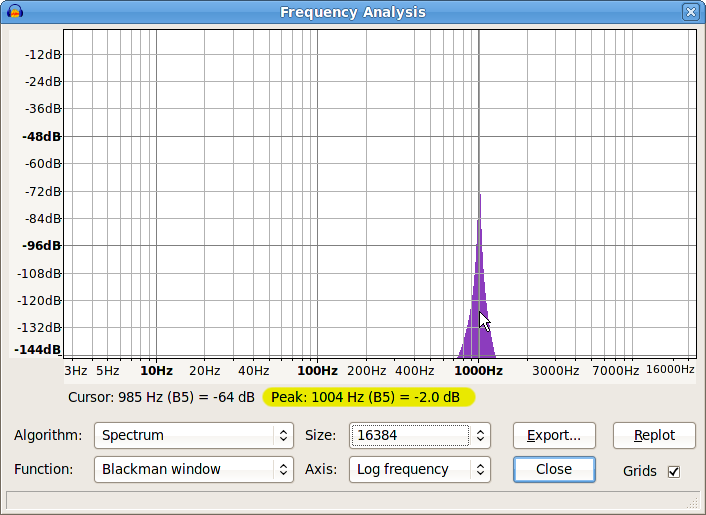
So the maximum precision that the FFT analysis can achieve is already available without zooming. Zooming in will not increase the accuracy because the data is only accurate to about +/- 3 Hz. For greater frequency precision, an even larger FFT size would be required, which for +/- 1Hz accuracy that would be something like 130000 samples, which would be about 3 seconds of audio. The problem then would be that short sounds (significantly less than 3 seconds) would be misrepresented because their value would be averaged across the FFT window (a 1 second sound would only show at about 1/3 of it’s actual amplitude).
The current design of Plot Spectrum gives reasonably good and easy to understand results with a wide range of options. Greater precision for constant test tones could be achieved by allowing even greater FFT sizes, but in the context of music and other real world audio, the results would becoming increasingly misleading due to the limitations of FFT analysis. Of course if anyone can devise an analysis method that can produce greater precision for short sounds, then not only would that catch the interest of the Audacity developers, but they would probably also win a Nobel Prize ![]()