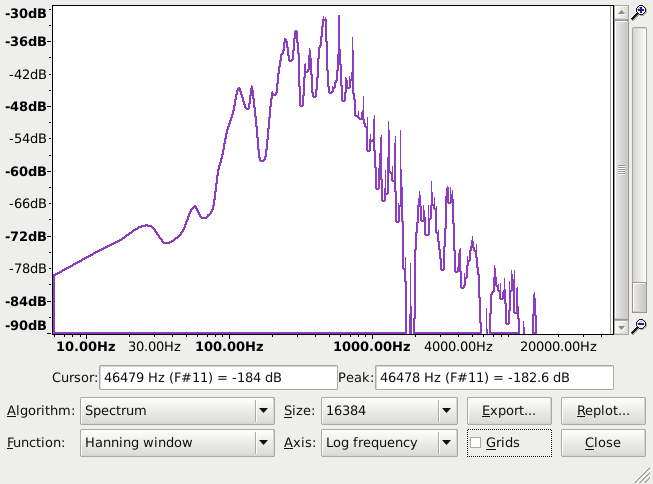
Firstly, as a new (72 year-old) user, please allow me to write a heartfelt thank you to all the developers of this very capable software. I have been using it to prepare old LP recordings for transfer to DVD for posterity and have just discovered the spectrum analysis function which I am using to assess different approaches to playing my clarinet. Is there any way to change the printing of the spectrograph so that it is not a ‘solid’
graph and only prints the outlines of the peaks? I am trying to save printing ink!!
Thank you in advance.
Brian
Assuming you are asking about Analyze > Plot Spectrum, no. But you could perhaps try Export… to a text file. You should then be able to make a bar graph from the data using Excel or your favourite spreadsheet application.
Gale
Thank you very much. I will give that a try.
Brian
Another option would be to edit the image (for example in the free image editing application “Gimp”) to remove all but an outline.
Gimp is a rather “advanced” application, so you may need to find someone to help you, or spend some time learning how to use it, but the basic procedure is:
- Select the pink area using the “magic wand” tool
- “Shrink” the selection by a few pixels
- Delete the selected area
- Print the modified image.
“Edge detect” also saves on ink …
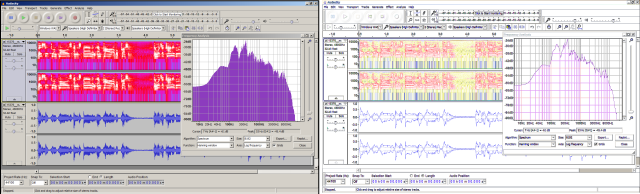
“Edge detect” is available on GIMP, but in this case IrfanView was used, which is a simpler, lighter, program.