Using Audacity 2.3.2, I found a bug while attempting to clean up a recorded file. Plot Spectrum indicated a peak of 58 Hz. When I applied a narrow (50.0) Notch Filter at 58 Hz, it made no difference. Turns out the actual peak was at 60 Hz; after I applied the Notch Filter at 60 Hz, Plot Spectrum showed the noise was gone.
Reproducing the bug is very easy…
Open a New file (File > New)
Generate > Tone…
Waveform: Sine, Frequency (Hz): 60, Amplitude (0-1): 0.25, Duration: 1.000s, click OK
Analyze > Plot Spectrum…
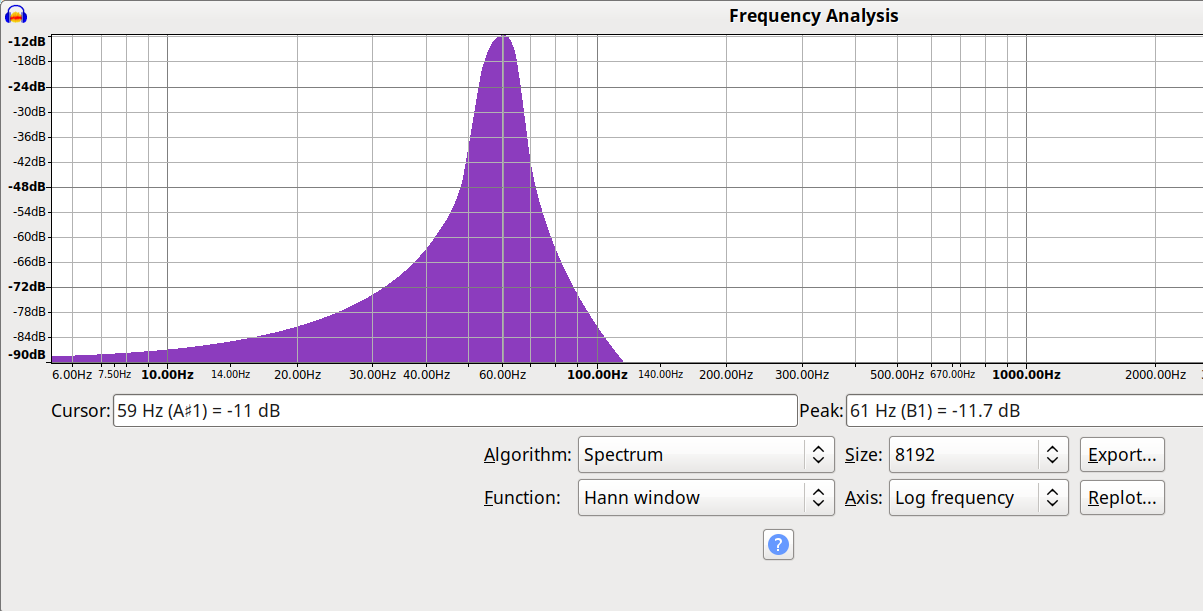
In the Frequency Analysis window (Algorithm: Spectrum, Size: 8192, Function: Rectangular, Axis: Log & make it as large as possible to see detail), place the cursor at the exact peak of the plot. Note the Cursor: value indicates the peak is at 59 Hz, while the Peak: value says 58 Hz (A#1). (But you know you generated a 60 Hz tone.)
If you wish, experiment with the Notch Filter to further examine the problem.
As shown below, I’m seeing the peak reported as 61 Hz, but you are using a different window function (I’m using the default “Hann” window as you can see)
Plot Spectrum uses FFT analysis, which gives an approximation of the frequency spectrum. A larger window size gives a closer approximation on frequency values: