Hi I could really use some help I am a newbie and don’t fully understand this what do these two files tell you your advice will be much appreciated thank you PSI’m using Windows 8.164 bit
spectrum.txt (12.3 KB)
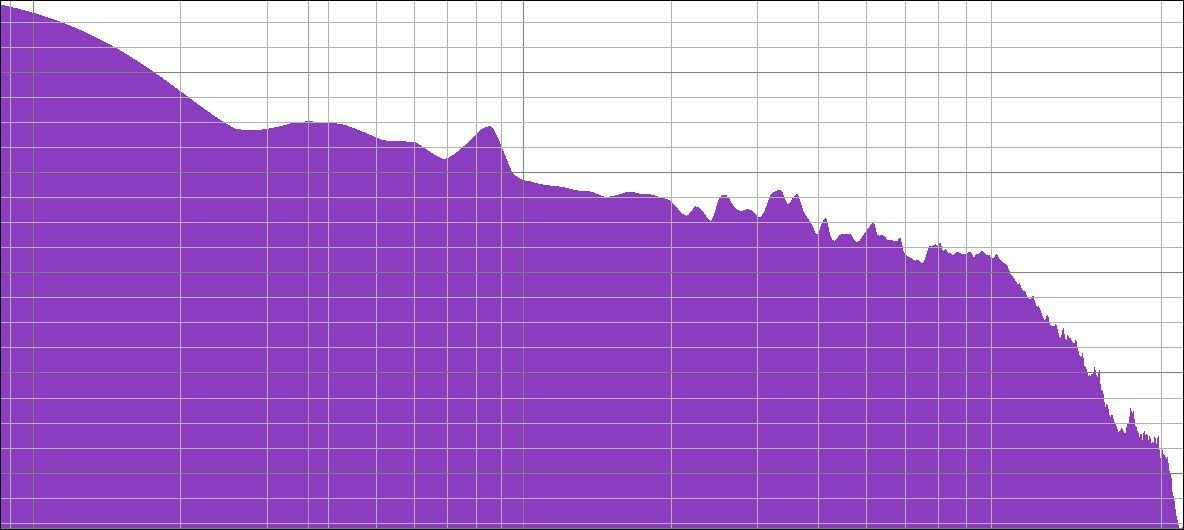
Plot Spectrum takes the selected audio (which is a set of sound pressure values at points in time) and converts it to a graph of frequencies (the horizontal scale in Hz) against amplitudes (the vertical scale in dB).
See here for more information: http://manual.audacityteam.org/o/man/plot_spectrum.html
The graphic is pretty, but pretty much useless without the left and bottom edges. The left edge tells you how loud and the bottom edge tells you what pitch the sound is.
You shouldn’t go into analysis in a vacuum. The settings along the bottom edge will change the display enormously and tell you different things.
It’s good to know that anything to the left of 20Hz (cats predicting an earthquake) and to the right of 20,000Hz (dog whistles, bats) can’t be heard. But even though you can’t hear them, they still affect Audacity tools and filters. Out Of Band trash like that can sometimes result in a tilted-head questioning look when tools don’t do what you assumed they were going to do. USB microphones and interfaces are famous for creating inaudible rumble (thunderstorm) in addition to the show. Spectrum Analysis can show you that.
Koz