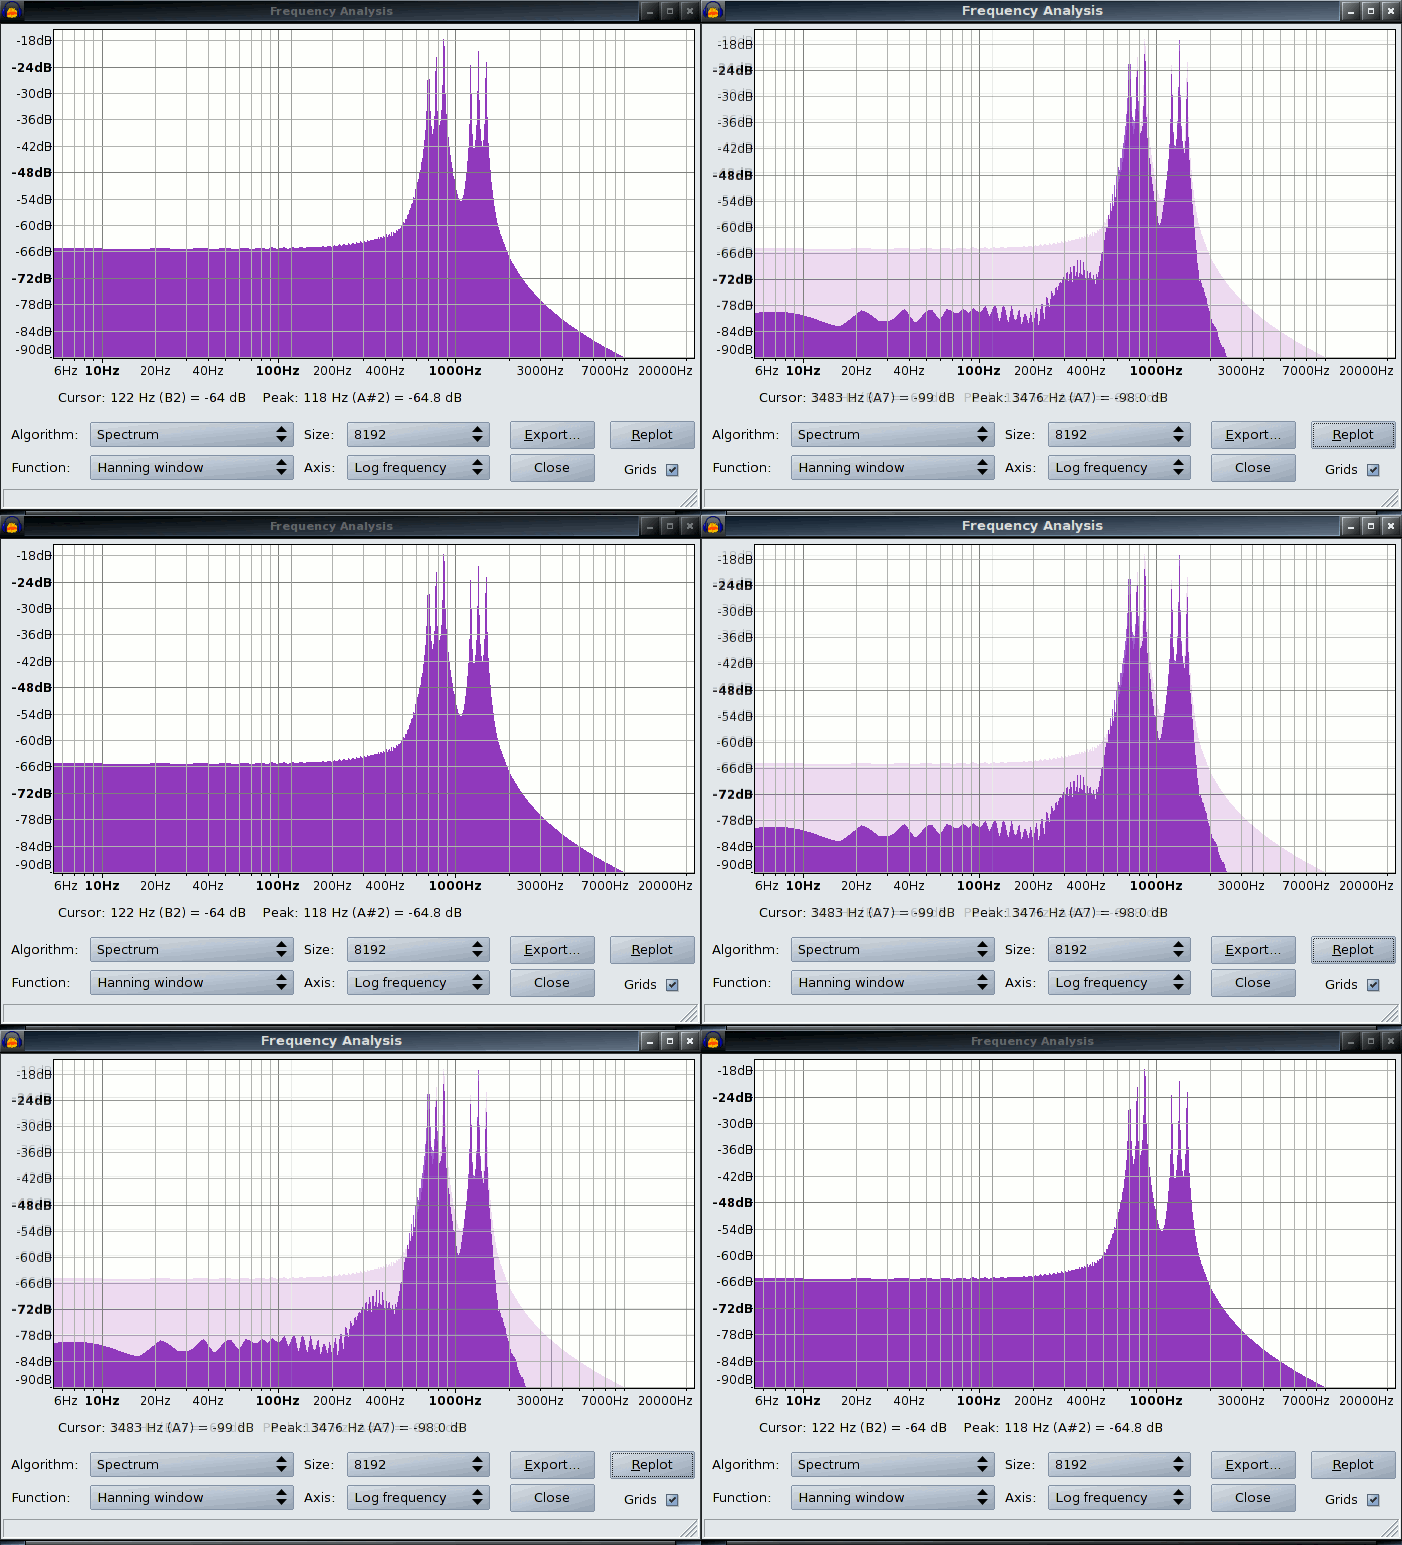
I am mixing together multiple parts from different instruments. I’d like to get an idea where the different parts are competing on the frequency spectrum.
Running a frequency analysis of a single part or the whole piece is easy - but is it possible to overlay the analyses for each part?
At the moment I need to manually do it separately for each part, and manually compare the graphs.
A workaround : Use Audacity’s built-in screenshot (screengrab) tools to make images of frequency analyses, then combine those images in a Photo-shop-like program such as GIMP , (which is free), which allows images to be stacked in-register , e.g. …

That only works if the vertical scale is identical in both cases. Often it is not.
Another option is to export the result of each analysis, import those into a spreadsheet and make a graph there.
– Bill
