Hello, i’m new here and hope this is the right sub forum for my questions.
My ultimate goal is to evaluate the noise (and THD) performance of Recording/Playback/Process setups
And express this as dBV/Hz vs. frequency graph As well as dBV(A) equivalent input noise.
(i can easily calibrate dBFS to voltage reference so just assume 0dBFS=0dBV)
At first i naively thought i can just use the “plot spectrum” function and reed of the values.
Spoiler its not that easy!
What “kind of dB” is the dB scale in the Plot Spectrum window?
i assumed its dBFS(RMS)/Hz. but is it “Power” like in “Power-Spectral-Density”
So i generated a sine wave with amplitude1 or 0dBFS peak to peak. “Measure RMS” says its -3.01dB http://www.sengpielaudio.com/calculator-db-volt.htm I expected the Plot Spectrum to also show -3db. but it seams to show 0dB (its hard to read because of the narrow spike)
Now the interesting part:
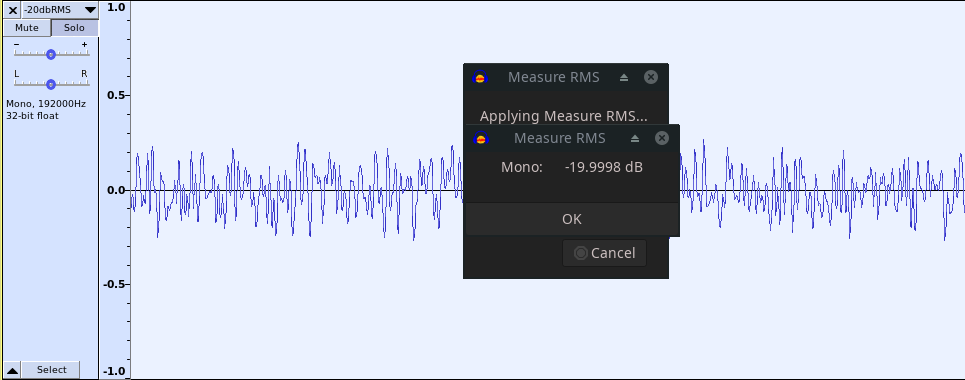
Generated White Noise at 192khz ,resampled to 44.1 and back to 192(effectively limiting it s bandwidth to ~20khz), i amplified it to -7.408dBFS to end up with
-20dB RMS ~20kHz bandwidth white noise.
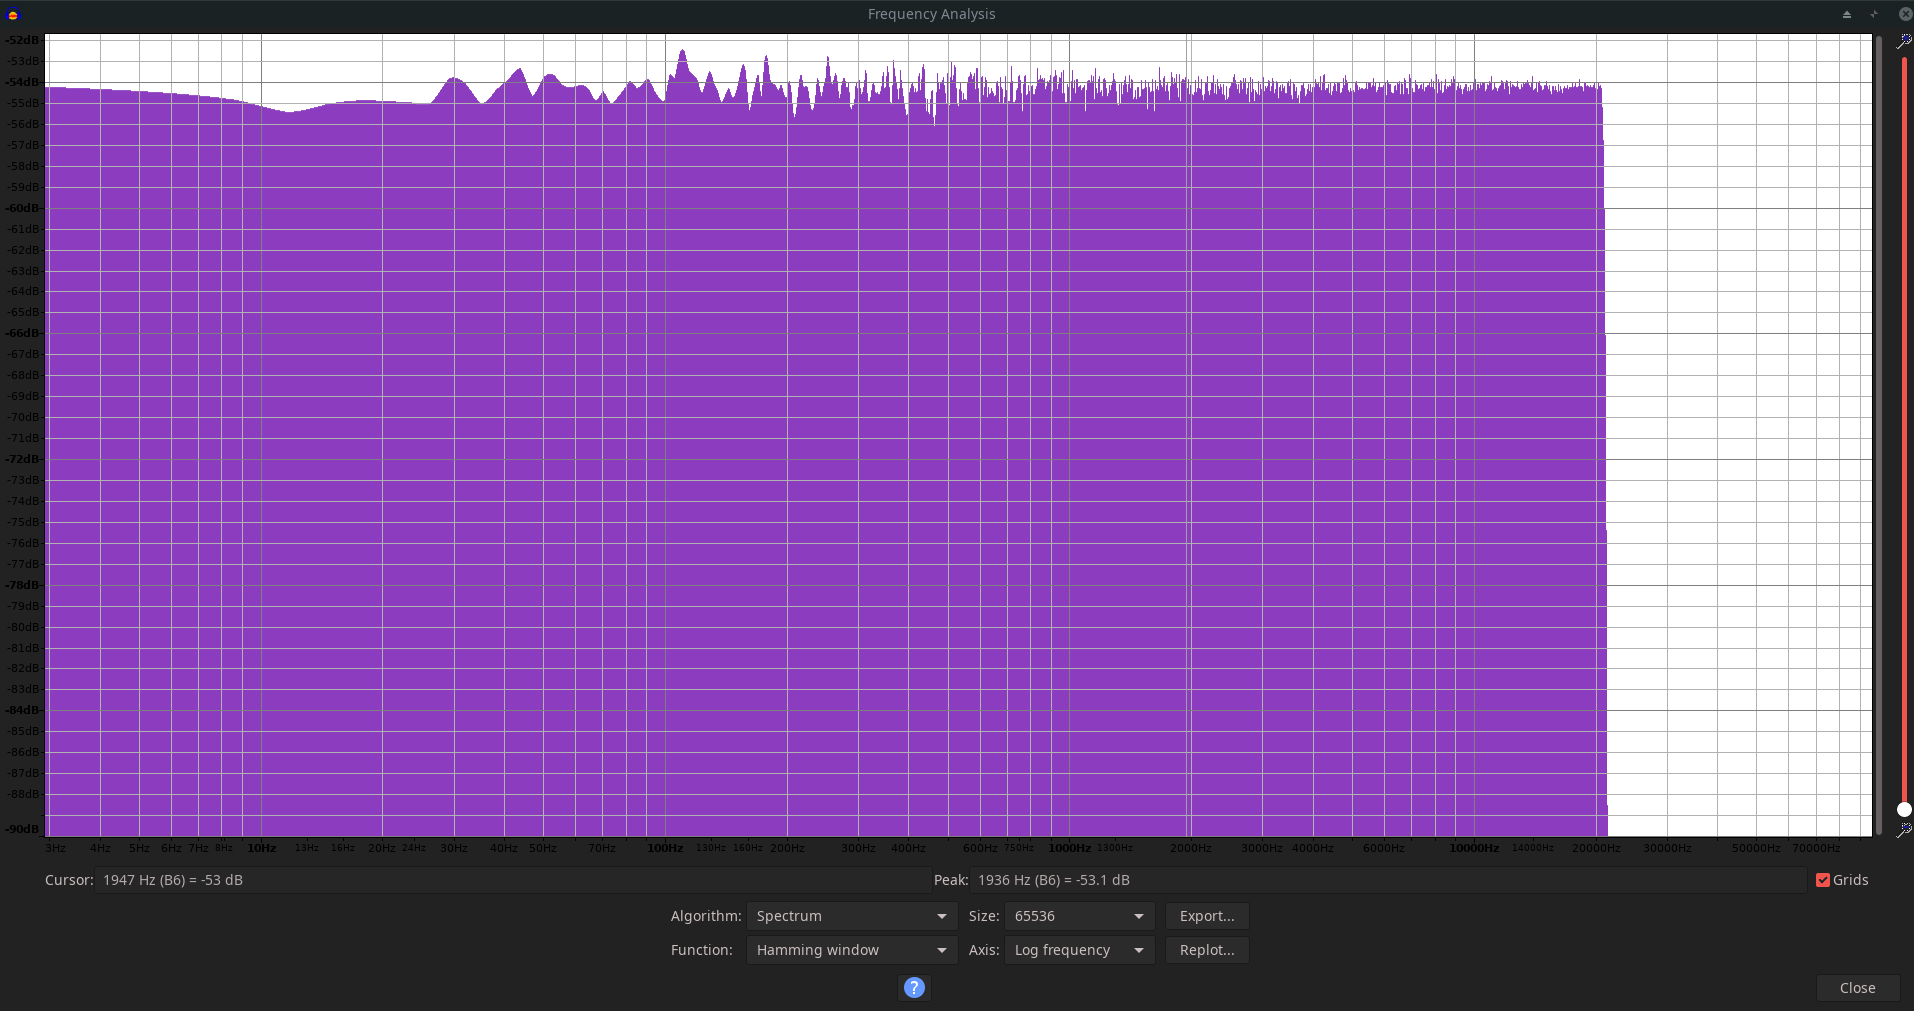
In the Frequency Analysis its about -54dB.
But whats the real dB(V)/√Hz of this signal? https://sound-au.com/noise.htm
sqrt(20k) = ~141
The signal per Hz is therefor 141 times lower?
According to http://www.sengpielaudio.com/calculator-db.htm that’s about 43dB if i calculate with Log20. Do i have to calculate with Log20 or Log10? (since we are dealing with “Power-Spectral-Density” in this Case it would be 21.5dB)
In any way i would expect to see -20-43=-63dB (or -41,5dB) but i see -54dB.
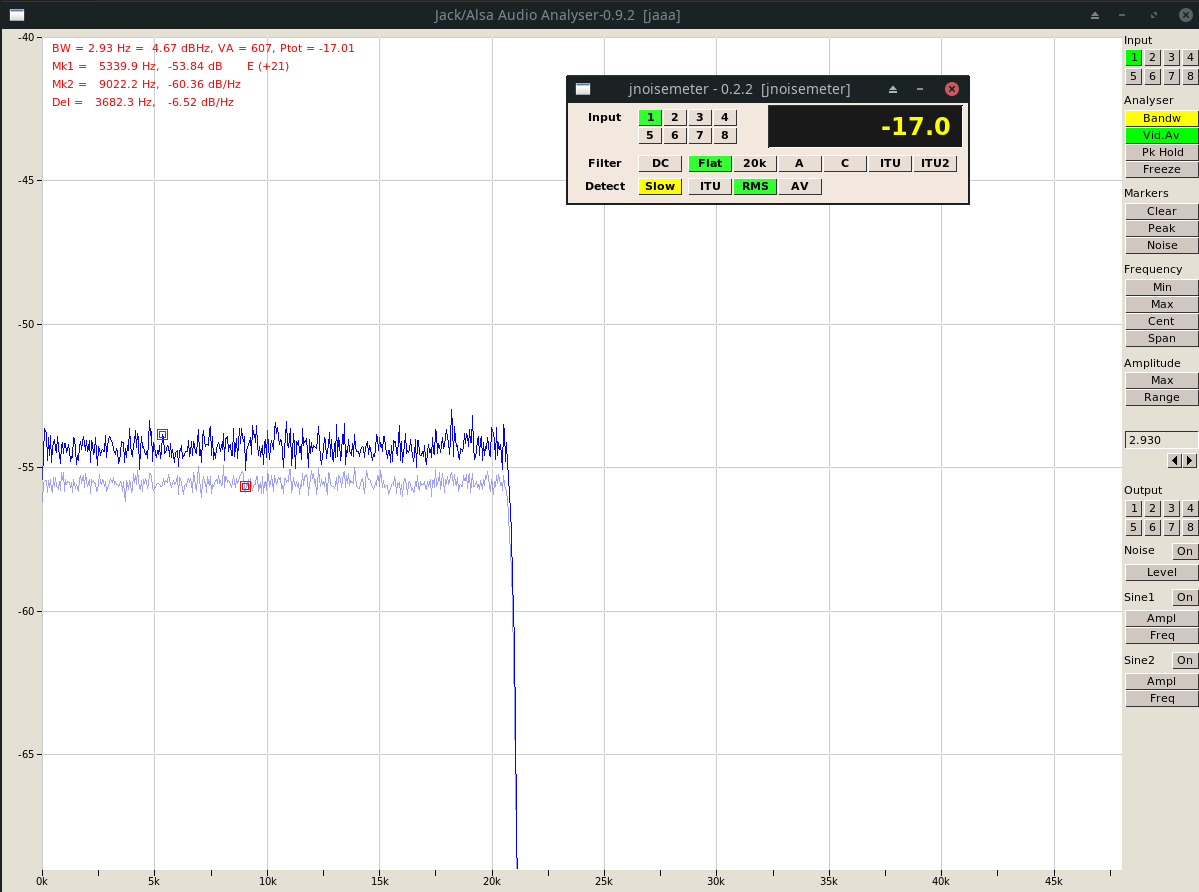
To confirm this i run it trough jnoisemeter and jaaa.
Jnoisemer and Jaaa calls this signal -17dBRMS Why is it 3dB more then what Audacitys RMS measurement says?
Assuming it relay is -17dBRMS
-17dB-43dB=-60dB/Hz
~-60dB/Hz is also what Jaaa shows in the upper corner for Mk2.
There’s a lot to unpack in your post, so I’ll post multiple replies. This is the first.
Plot Spectrum measures the amount of “stuff” in each of the FFT frequency bins.
For example, if the signal is white noise, and the FFT size is 256, then there are 128 frequency bins (including DC and the Nyquist frequency).
The values are normalized such that a 0 dBFS (peak) sine wave will measure (approximately) 0 dB.
In both cases the unit (voltage or sound pressure) is not power but amplitude?
You can get the RMS value either from the “Contrast” tool
that’s what i did. but the value (-20dB) is different then the value Jaaa and jnoisemeter are returning.
The values are normalized such that a 0 dBFS (peak) sine wave will measure (approximately) 0 dB.
This means the total of all bins can be bigger then 0dBFS? or is the total over all frequency normalized to 0 dB.
this would also result in a sine wave beeping normalized to 0dB.
If I run a full scale sine tone through jnoisemeter, it gives me a “RMS” value of 0.0, which is not what I would have expected, though I note that this is consistent with the documentation: jnoisemeter(1) — jnoisemeter — Debian jessie — Debian Manpages
All three detectors will show 0.0 dB for a ‘digital full scale’ sine wave (i.e. peaking +/- 1.0).