Maybe white bar for a second or two at the RMS level when using RMS meter.
Maybe this is already designed. Do you know what a BBC PPM is? Instead of a nervously bouncing sound meter, it has a very rapid attack but then hangs up there for a split second before slowly sinking back down to zero. It’s much easier to derive peak readings and keep yourself out of trouble in live performances. This could be applied to both the Audacity peak and RMS meters as an option.
Koz
The “Gradient” display option already has this feature.
The “Gradient” display option already has this feature.
“Has this feature” meaning the little markers that hang around, not the BBC ballistics.
Koz
Yes.
But this suggestion is for the RMS display option to have this feature.
I think bright green bar so that as the dark green comes down the bright green bar hangs where the RMS level was.
Kozikoski’s suggestion is a great one too.
The light green bar indicates the peak level. If it “hangs around where the RMS level was”, then that will be misleading regarding the peak level.
The problem is that there could be hundreds of different meter designs and different users would prefer different ones, but unless / until Audacity supports “plug-in” meters (so that people can download or create their own), it is impractical to provide hundreds of different meters.
Some previous suggestions:
- Allow meter to dock vertically at any edge/corner (9 votes) - this a) lets you resize the project window without losing the relative position of the meters b) lets the main window keep focus so still accept the R “Record” shortcut after clicking in the meter to monitor. This same argument can be extended to all toolbars.
- Vertical dock must be at reduced width too (4 votes)
- Configurable samples-to-trigger : (6 votes) Meters require 3 consecutive samples to clip, Show Clipping 1 sample and View Clipping 3 samples (by default); user should at least be able to change the meter trigger value with 1 sample being offered
- Configurable level-to-trigger : (3 votes) Useful if the hardware insists on clipping below 0 dB e.g. SoundBlasters.
- Proper window with minimise/close buttons and title bar as in 1.2 (10 votes)
- Standards-based meter: See details. (5 votes)
- EBU standard R128 (1 votes)
- ANSI C16.5 VU meter (1 votes)
- Per-track recording meters (4 votes)
- LED/bar type with sticky peak sections: (4 votes) Especially helpful for live recording. Now you need to watch the meters in real time, and the sliding peak indicator only holds position for a few seconds. Cakewalk Sonar has this with a reset button.
- Reset button for red clipping hold light (2 votes) irrespective of type of meter bars
- Compressor/limiter peak hold line to show maximum amount of compression/limiting since starting. Can help finding right settings without having to watch very closely.
- Display meter ticks/values above 0 dB/FS (2 votes)
- Control for Meter/Waveform (dB) display range on the fly instead of in global preferences (2 votes) Cascading menu item "Meter/Waveform dB range > " in the right-click meter menu?
- Display/name the input being monitored (1 votes) I understand that this info would have to initially come from the drivers and that it might be named poorly. I’d like to change the name of each of these inputs myself. For instance, I have a card with 8 analog inputs, and 5 different input names, multi (for access to all the inputs), and 1/2, 3/4, 5/6, 7/8. In the Edit → Preferences menu these all have the words “M-Audio Delta 1010LT” in front, but I don’t need to see that.
- Conform to EBU standard R128.
- Measures Programme Loudness (normalised to a Target Level of -23.0 LUFS), Loudness Range and Maximum True Peak Level (with a permitted maximum of -1 dB True Peak). See also Requirements for loudness and true-peak indicating meters, ITU-R BS.1771-1.
- Measures with a meter compliant with both ITU-R BS.1770 and EBU Tech Doc 3341.
- Includes a gating method as specified in ITU-R BS.1770-2. The relative gate ensures that audio below a given threshold is left out from Loudness measurement, because human perception of loudness is chiefly determined by the loudest passages or “foreground sound”.
- It’s not an ANSI C16.5 VU meter, it’s a digital peak meter.
- EBU Technical Publication 3205-E: Section 2.4: Reversibility error < 0.5 dB
- IEC 60268-17 ANSI C16.5: Reversibility error < 0.2VU, generally 0.2 dB
- positioned very near the record level control
- phase-error indicator (if absolute averages of (L-R) > (L+R) then your inputs are probably out of phase)
- What if you were recording with a true stereo microphone, I think the sounds on the Left would show an out of phase condition when both channels are compared. likewise the sounds on the Right side. (phase-error indicators are mainly to show if you have your inputs wired incorrectly).
- Equation strictly is |L-R| > |L+R|, i.e. ignore the signs on the results. Hence for a blumein or similar crossed pair, this will only occur if the sound is outside the V of the pair of microphones at the side. This is equivalent to side on sound in a Mid / Side microphone setup. Either way the key thing is that mono listeners to the result will get little or no sound, which is very confusing. Any recording produced like this is likely to get a poor reception if played in mono.
- An alternative implementation of this is based on an X-Y display of the inputs turned through 45 degrees, which will show horizontal or vertical depending on the phase of the inputs.
- Given the above, maybe it should be possible to send the mix to the meters as well as the inputs to the meters. Very easy to cause by crossing leads inside balanced audio connectors.
- As well as a peak meter, it would be very useful to have an RMS meter (as seen in Wavelab).
- From the radio point of view a PPM meter is much more useful than the much slower VU type. This would be very useful. Currently use a freeware one , but would be much easier/better to have one built into Audacity.
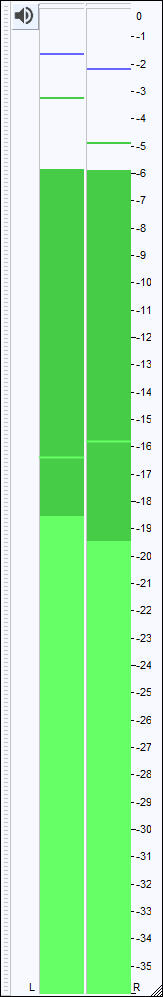
I only see dark green and blue hanging bars in the RMS meter. But a specific color isn’t the enhancement request.
This a small enhancement to the existing design.
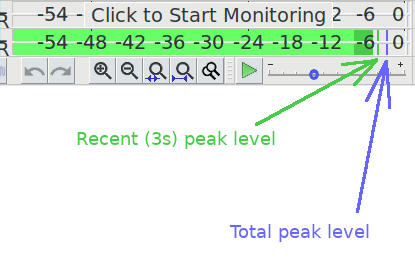
OK, so currently when the “RMS meter” is used we have two “peak indicators”, one for the highest peak since the start of playback, and one for the highest peak in the last 3 seconds (as shown in image below).
Am I right in thinking that you are suggesting adding a third “peak indicator”?
If so, what would that peak indicator indicate?
What happens if it coincides with the “Recent Peak” indicator?
Yes a third hanging bar to indicate the RMS peak (the bright green). Don’t think it would ever be the same as the peak (dark green or blue). But if it is then same strategy as if those two are the same. Believe it shows the blue. If RMS peak and peak are the same then show the peak (dark green). If all three the same then show the blue.
Most of the code should already exist. Just apply it to the RMS peak with a different color bar.
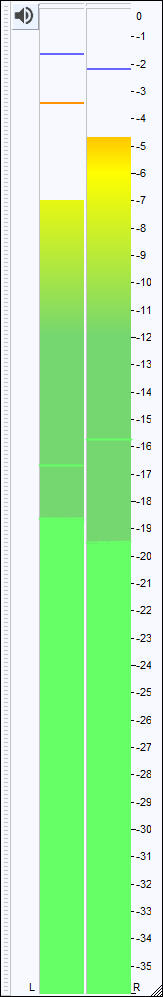
Example:
Though I don’t understand why gradient and RMS are split out separately.
RMS and Gradient Combined Example:
Would this be the “maximum RMS since the start of playback”, or the “maximum RMS in the last 3 seconds”?
If it’s the max since start of playback, then that could easily be the same or higher than the max peak in the last 3 seconds, which is why Audacity would need to be coded to handle that.
When the peak in the last 3 seconds is also the highest peak since the start of playback, the blue line takes precedence over the green line.
I assume that you mean that the order of precedence would become:
- blue line
- green line
- new line
Is that correct?
Last 3 seconds would be more useful I think. But hey if you want to add a 4th I’m cool with that. ![]()
Yes to order of precedence.
I have logged this feature request as:
“Peak Hold” for RMS level: > Similar to the vertical bar that displays the highest peak of the last 3 seconds, but for the RMS level when “RMS” is selected as the meter style.