Ok I have been slaving over the Graphic EQ for a while trying to match the equalization between audio clips recorded in different settings.
I’ve been largely unsuccsessful… getting close, but still noticing a significant difference in various clips within my project.
UNTIL…
I had the idea to export the desired EQ spectrum to a .txt, and then do the same thing with the target clip’s spectrum.
I then pasted them into a spreadsheet, and subtracted the dB values of the desired-target… and viola! Exact dB values for each frequency to use in my matching!
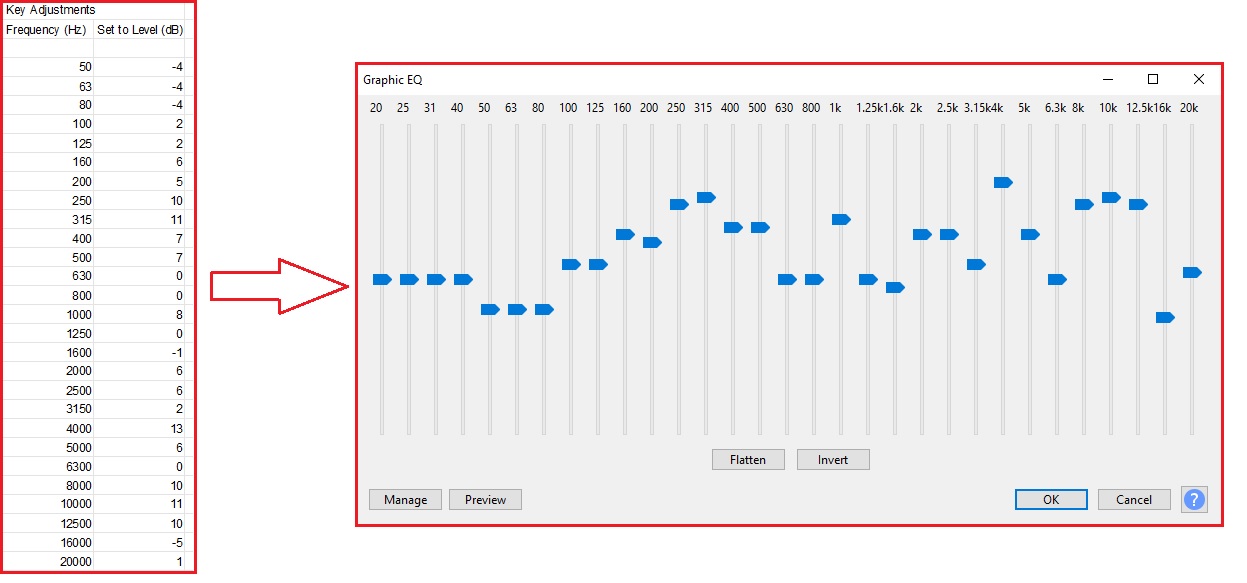
However… I have over a dozen clips to fix, so this becomes a painstaking process of moving the sliders around to match a chart like below:
So what I’m wondering, is if some software genius on this forum (which I am not) may be able to suggest a way to automate this process, and then export an EQ “spectrum matching profile” preset for the Filter EQ. If you export a filter EQ’s preset, it looks something like this:
I think that the plug-in does still work, but it outputs Equalization settings in the old Audacity 2.x format.
For Audacity 3.x you would then need to use the “EQ XML to TXT Converter” (EQ XML to TXT Converter - Audacity Manual) to convert the settings to the newer “Filter Curve EQ” format.
I read through this thread and I’m not sure I completely understand the goal of the plugin… it looks like it grabs the spectrum profile from a given frequency plot, and then converts it directly into an EQ curve. Is that the case?
My goal is to capture the difference between a given target spectrum, and the spectrum from a desired sound clip, generate the delta, and convert that to an EQ preset.
This looks like the goal of this plugin is to directly convert the given spectrum from a “bad” clip directly into a carbon-copy EQ curve, and then if you desire, invert the curve and flatten out the spectrum of the given clip.
It appears that then you would do the same thing with the spectrum of a desirable clip, not invert it, and apply that one’s EQ curve to the flattened curve in the previous process.
This would take longer than what I’m doing to complete the work I’m trying to achieve… if I’m understanding this right.
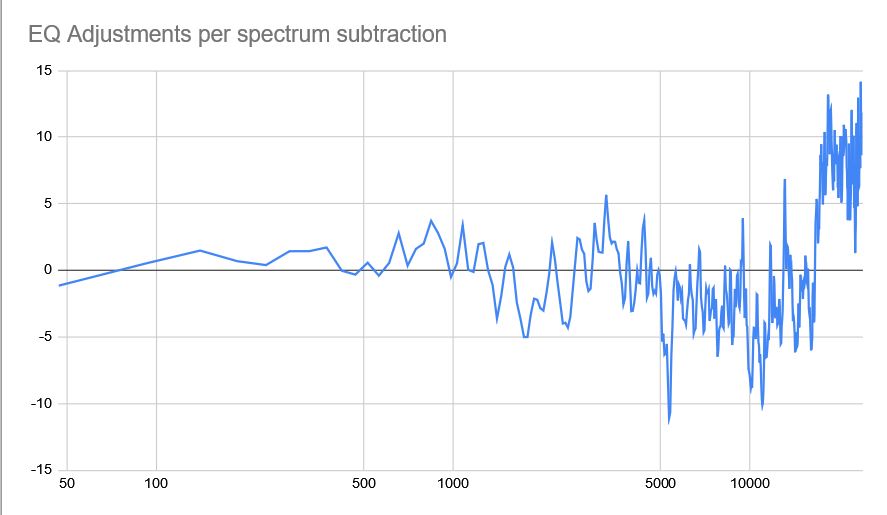
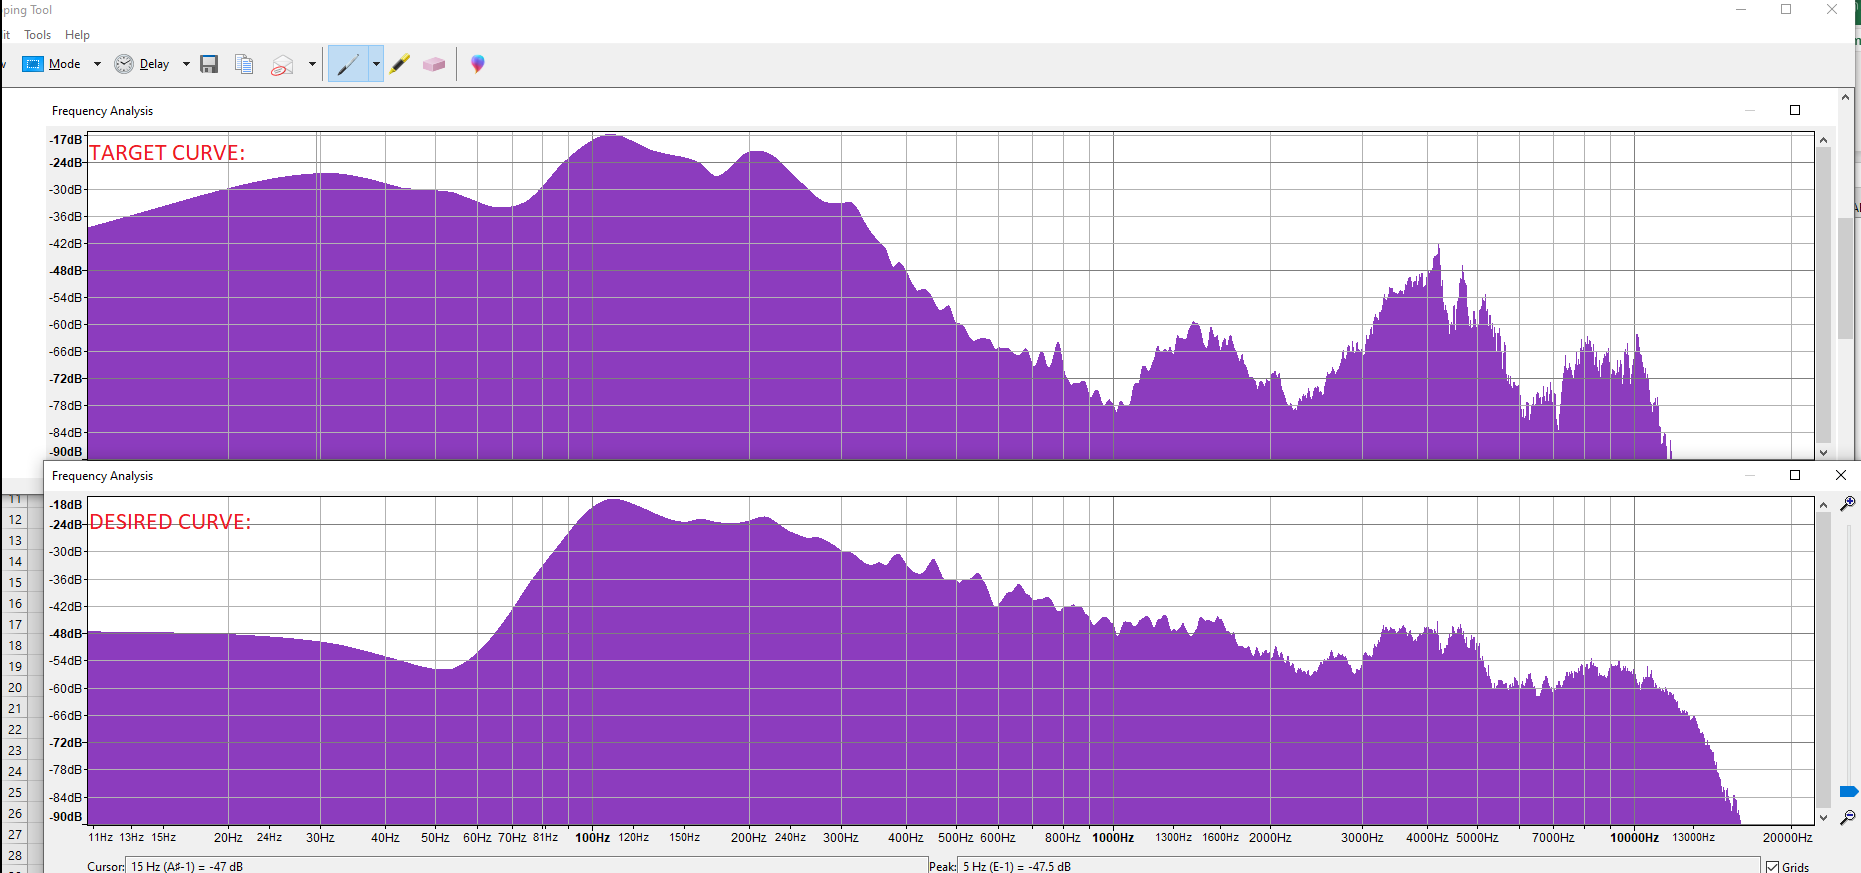
If I chart the “adjustment curve” that is to be used to get “Target Spectrum” adjusted to “Desired Spectrum”… the chart on the left is the values of the delta curve, and the chart on the right shows the difference that the chart on the left is plotting:
Since yesterday I’ve added a VLOOKUP to my spreadsheet, and had it search the closest values to those bands listed in the graphic EQ effect. I then manually adjust the EQ per the table as shown:
HOWEVER: If I feed this plugin the delta curve, I should be able to generate an EQ curve that will adjust my audio clip from that, correct? That would take a step out of my process… and it would be the longest step of manually adjusting the EQ sliders.
It looks like there’s a version that has more than 128 points?
Ok I’ve optimized as much as I can with simple spreadsheet and cut&paste operations.
The desired curve is at the bottom, the target curve on top:
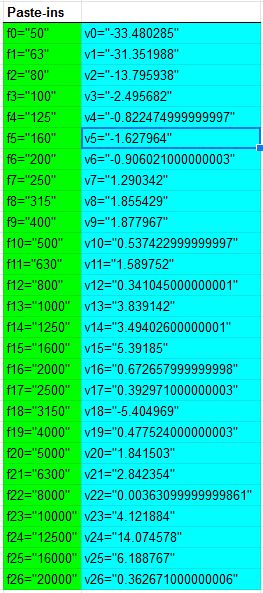
Once I’ve exported the spectrum of both the desired and target clip curves, done the delta calculation, and the vlookup, the spreadsheet output looks like this:
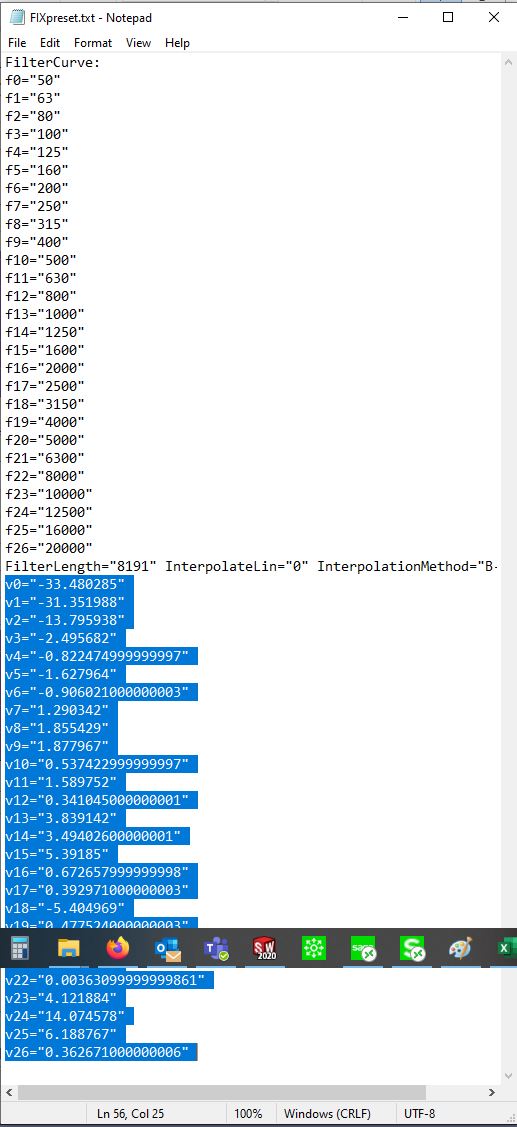
I take and paste these into the text file for the Filter Curve EQ preset (having generated one at random points and then modifying it):
I only need to export the frequency values once, as they will be the same every time (matching the graphic EQ bands, just because they are a good reference). I will need to paste in the “V=”" values every time I want to change a clip… but the match is very good.
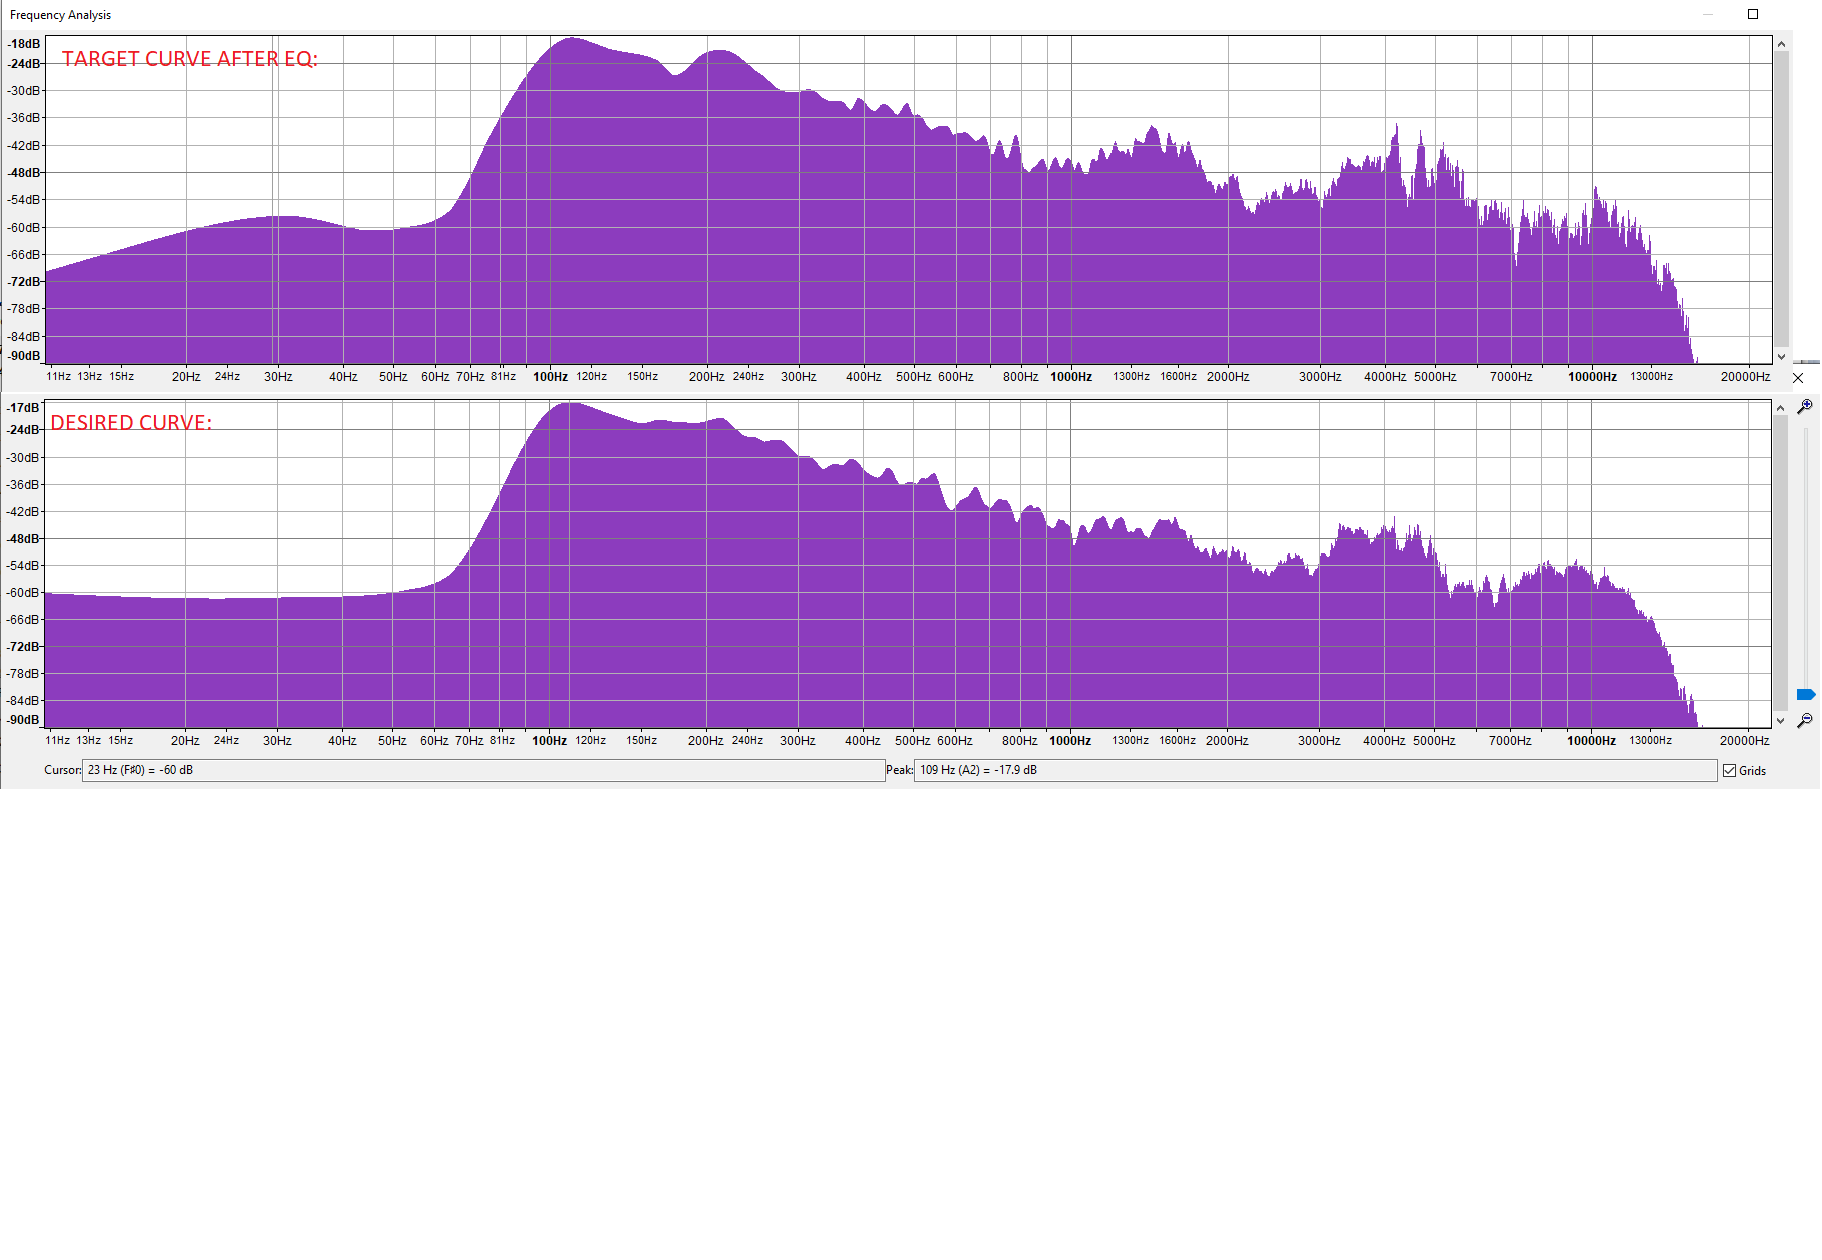
Then I import the txt file to the filter curve eq, and apply it to the clip, and afterward the comparison looks like this:
As you can see (ignoring everything below 60hz, as this is a vocal track), the match is pretty good. This is, to me, less work than feeding the desired curve to the plugin mentioned above, and then neutralizing a track, then reapplying the eq curve.