Newbie/ neophyte here.
Audacity is amazing. I’ve used it to analyze how long it takes a pellet in my pellet gun to exit the muzzle after the trigger is pulled. Audacity worked great for this.
I hope to now use Audacity to study vibrations. I want to download the frequency plots to excel to do further analysis. But in my test run, the excel chart from the sample export of an 11 millisecond sample does not match up with the Audacity plot. I attached a jpg with the Excel chart directly over the matching data on Audacity.
What am I doing wrong?
Regards to any and all who can guide me on how to transfer my Audacity plots into excel
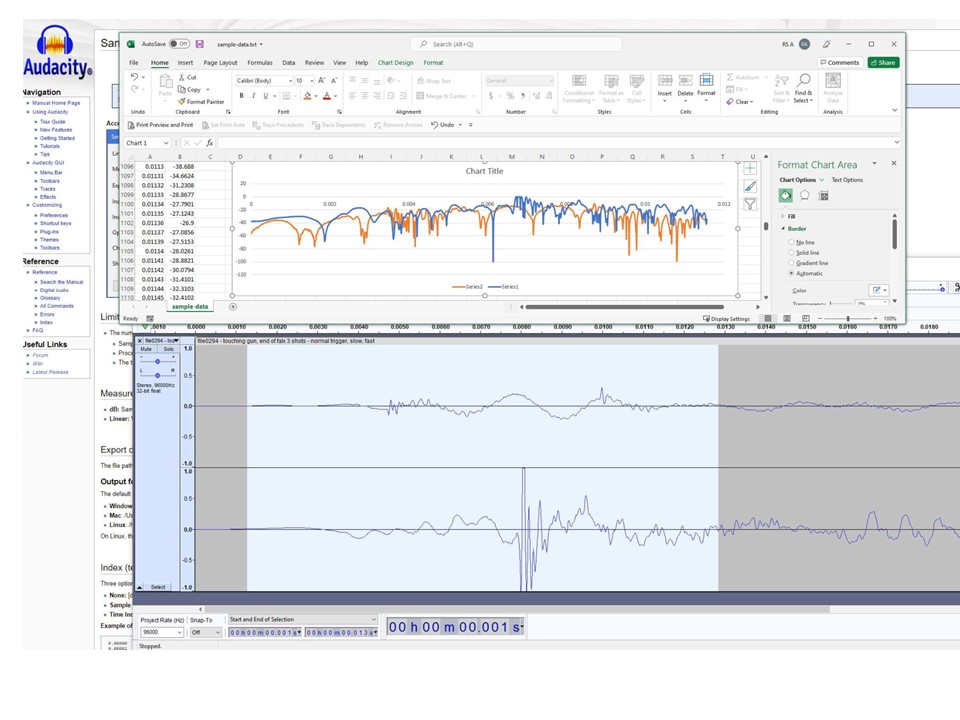
You’re using “Sample Data Export” and loading that into Excel?
It looks like you have exported the “dB” data. Try exporting “linear” instead.
When exporting the samples as “linear” values, each sample is in the range +/-1, which should match up with the waveform seen in Audacity.
When exporting as dB values, sample values are represented on a logarithmic scale in the range 0 (full scale) to negative infinity (silence).
Switching to “Linear” fixed the problem! Thanks!
And thank you for the explanation of linear vs dB.