Hi all, firstly I know nuts about sound and unfortunately my project is heavily focused on it. Basically, I measured an experiment with a sound level meter - straight to the point, I know the decibel it was reading at. At the same time, I took a recording of the sound with the intention to validate the results gathered from the meter against Audacity. Also I just wanted to know at that particular decibel, what frequency was it at.
But upon using the 'plot spectrum" function, I got confused with
why is my decibel axis negative?
with the frequency axis all so vast, how do I know where to look at
You know the dBSPL Sound Pressure Level. That’s important because that’s not what Audacity is doing.
dB in Audacity is dBFS, dB Full Scale. Zero is maximum volume, the loudness where the digital system runs out of numbers and starts damaging the work. The readings get quieter (negative numbers) from there.
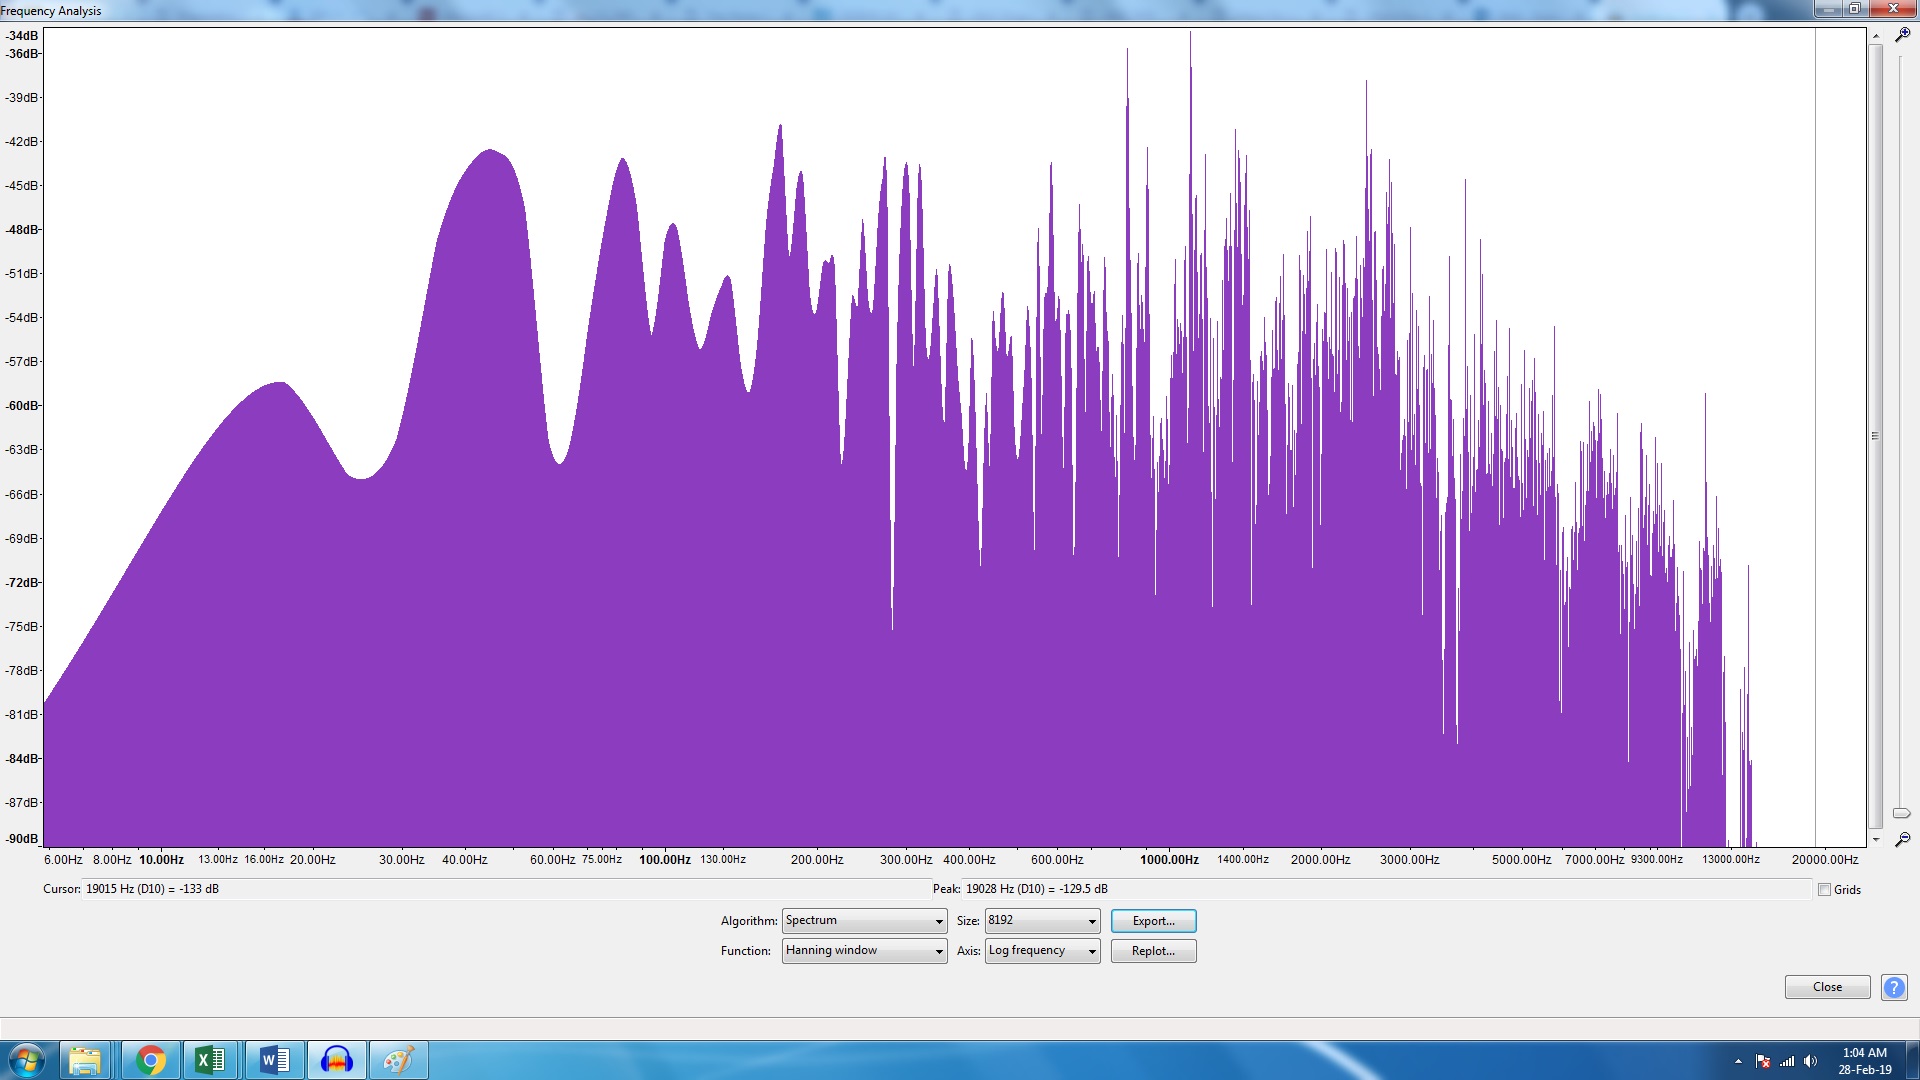
Analyze > Plot Spectrum measures volume top to bottom and pitch tone left to right. There is no time. It lumps everything in the clip you selected into one picture. In your illustration, something in your selection made a sound at 40Hz. That sound produced that hill above 40Hz, measured along the bottom.
It’s good to get a sense what those pitches are. 100Hz and to the left are thunderstorms, earthquakes and very large trucks driving by. 440 is that sound the oboe makes at the beginning of the orchestra. 3000 Hz is baby screaming on a jet and 8000hz to15000Hz is crisp hissing that bats, dogs and young women can hear.
There’s another way to do this. Menu to the left of the Audacity timeline > Spectrogram. That one does measure time along the bottom, pitch up the left and it tries to tell you volume with the color change.
You should know that these tools tell you more and more stuff if you drag the windows larger. No, plot spectrum doesn’t have a magnifier.
I just wanted to know at that particular decibel, what frequency was it at.
If you’re measuring Real Life or Natural Sounds, this could be an adventure. Real Life sounds are a combination of many different pitches, tones and arrangements.
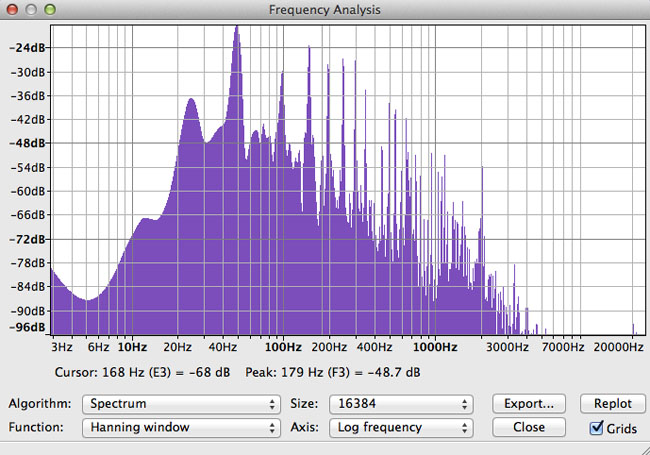
This is the spectrum of one single piano note (somewhere down on the keyboard left).
There is no direct correlation between dBSPL and dBFS. The best you can do is relative readings and that will depend on the calibration of the microphone. This sound is probably 3dB higher than that one—with no idea what the actual readings are.
You don’t have a single frequency. I assume that’s a music file? All real world sounds contain multiple frequencies. The harmonics & overtones are what makes a trumpet sound different from a piano playing the same note (frequency) and it’s why two singers sound different when singing the same notes. And of course, most music contains multiple instruments playing different notes & chords.
You can use Generate to generate a pure sine wave.
You can’t (easily) get the overall volume/loudness from the spectrum. The spectrum shows the amplitude of multiple frequencies (or frequency bands). You’d have to add-up all of the frequency components.
why is my decibel axis negative?
Acoustic sound levels (sound in the air) is measured in dB SPL (sound pressure level) where the 0dB reference is approximately the quietest sound that can be heard so SPL levels are positive.
The digital reference is 0dBFS (zero decibels full scale) where 0dB is the “digital maximum” so digital dB levels are usually negative.
There is a direct correlation - If you drop the digital level by -6dB, the SPL level will also drop by -6dB.
But, typically there is no calibration. However, you can make your own calibration if you have an SPL meter. Of course, if you change the volume control or move the speakers, etc., the calibration is no longer valid.
But typically, you can only make a calibration with a constant tone at a single-frequency. SPL measurements are usually short-term averaged and [u]A-weighted[/u].
There is no direct correlation between “sound pressure level” (as read from a sound level meter), and “signal level” (as observed in Audacity).
A simple example:
If you are stand 1 m away from a machine and your sound level meter says the noise level is 60 dB (a bit louder than normal conversation), and you start recording the noise, you would adjust the recording level to get a good level in Audacity - turning up the recording level will give a higher signal in Audacity, while turning down the recording level will give a lower signal level. There is no way that you can look at the signal level in Audacity alone, and determine what the sound pressure level was.
Decibels (“dB”) represent the level of something, compared with a reference level, as a ratio.
In the case of audio signals, the usual reference level is “full scale” (the maximum valid signal level), which is represented in an Audacity track as a level of 1.0 (full height of a track). The reference level is 0 dB. As valid signals are less than “full scale”, they are less than reference level - less than 0 dB, thus they are negative.
For sound pressure levels, the 0 dB reference level is usually taken as 0.00002 Pa, which is around the threshold of hearing. Thus, most noise levels will be positive, but an extremely quiet sound-proof room could measure as being negative on a dB scale (see: Inside the quietest place on Earth - BBC Future)
thanks so much for all of y’all help! The sound was produced by a spinning propeller on a thrust test!
I realized that I truly do not know sound and really need to do more research on my own
Anyway, since a young healthy human can hear frequency from 20 to 20k Hz, can I infer anything from the plot spectrum with that info?
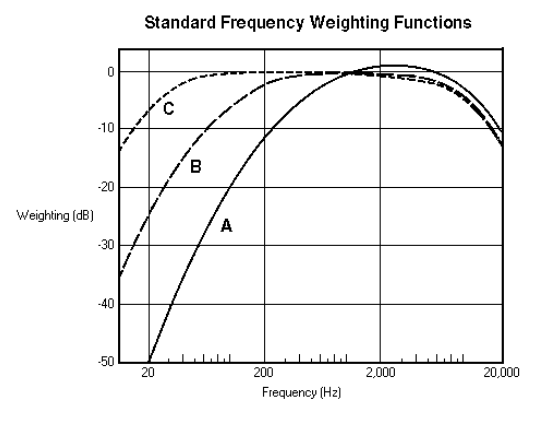
Actually, there’s a piece of this we don’t know yet. There’s different ways of measuring dBSPL. Which weighing or curve was the sound meter set for? The common options are “A” and “C”. “C” measures more or less whatever shows up equally.
“A” is the important one because it’s biased so it measures things roughly the same way your ear does. “A” is super important because that’s the one built into laws and hazardous condition measurements. That’s the difference between the rumble of a truck going by and baby screaming on a jet. They can have the same Sound Pressure Level in “C,” but very different numbers in “A”.
Nobody uses “B.”
Look over where about 3000 would be and see it’s right at the tippy-top of the “A” curve and within range of “C”. The truck rolling by at 100Hz still fits in the “C” curve, but it’s nearly invisible to “A”.
Audacity has no weighing or curves unless you apply an existing one in post production effects or make your own. Yet another reason there’s no good comparison between the two systems.
That’s not to say Audacity can’t be useful. When someone submits a noisy sound clip, for example, we can use Spectrum Analysis to help figure out what’s wrong. If the noise “hills” center around 50Hz and multiples up, we know the interference is probably located in Britain or Europe. Their wall power is 50Hz. If it’s 60Hz and multiples up, that’s probably happening in the US. If the interference is some oddball wacky number such as 83Hz, that’s probably computer fan noise.
We still didn’t quite hit why you’re doing this. Audacity can’t be used for law enforcement, hazardous measurements, surveillance or conflict resolution.
Since you’re measuring something physical, was it changing? Plot Spectrum is only useful if the sound being measured doesn’t change. The sound of a propeller revving up for flight would give no useful information because all the tone hills and valleys in the display would try to move.
Then there’s Doppler Effect. A train moving at a dead constant speed seems to increase in pitch when it’s approaching you and decrease when it leaves.
The sound was produced by a spinning propeller on a thrust test!
Since the spectrum is about the same every time you can ignore the spectrum/frequency and measure the average/RMS amplitude.
The [u]ACX check plug-in[/u] will give you the RMS, and A-weighted RMS dBFS levels which you can calibrate to dB SPL using your SPL meter. For example, if 80dB SPL correlates to -20dBFS RMS, then -25dBFS RMS is 75dB SPL.
Of course, make sure that you are not [u]clipping[/u]. (If your dBFS peaks are 0dB you are most-likely clipping.)