My dear illustrious Team Leaders and Senior Members of the Audacity forums,
I wanted to have the maximum amplitude for a section selected from an audio file, in dB. I searched for an appropriate tool to help me determine the maximum amplitude of that section of selection. But I have a doubt.
Is the tool “Measure RMS” under the menu “Analyse” appropriate for a particular segment? Suppose the tool outputs a value -115.258 dB. Is it supposed to represent the pick of the waveform form that particular selection?
The easiest way to find the peak is to run the Amplify effect. The default Amplification is whatever change is needed for normalized/maximized dB peaks. For example, if it shows +3dB, your current peak is -3dB. (You can cancel the effect if you just want to check without changing anything.)
Yes. But in case you don’t know this, RMS is a kind-of average. It’s not the maximum. If you have a pure sine wave, the RMS is 3dB lower than the peak. With music the RMS is typically 10 or 20dB below the peak.
============
And of course these are digital levels where the 0dBFS reference is (usually) the “digital maximum” so digital dB levels are usually negative.
Loudness in the air is measured in dB SPL where the 0dB SPL reference is approximately the quietest sound that can be heard and SPL levels are positive.
There is a direct correlation between digital and acoustic levels, but usually no calibration.
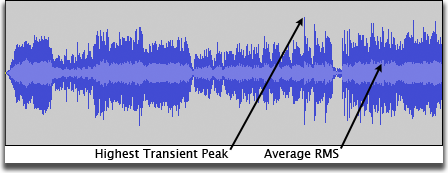
The pale blue area on the waveform represents the RMS value.
BTW -60dB is negligible. -90dB is essentially silence,
so paying attention to “-115.258 dB” is a waste of your time.
Thank you, Mr. Trebor and Mr. DVDdoug, for replying to my post.
Mr. Trebor, the mention of -115.258 dB was just arbitrarily chosen.
Is there any tool, other than what I have or Mr. DVDdoug mentioned, to measure the average loudness in dB of a particular selection area? Select the peak and then measure its dB?
Yes, I appreciate Mr. DVDdoug’s note that the RMS tool is the average loudness for the selected segment. I apologise for the typo “pick” instead of “peak” in my earlier post which I overlooked. I would have corrected the typo, but can’t edit it now.
There are some 3rd-party plug-ins that can measure LUFS (as well as peak and some other measures). (Audacity’s Loudness Normalization can adjust-to a particular LUFS level but it can’t just check it.)
These may not work with the current version of Audacity but you can try YouLean Loudness Meter. There is an online version but I don’t think it can analyze just a selection so you’d probably have to make a separate file of the part you want to analyze.
Apologise for causing you to assume that I don’t like RMS.
I was just trying to learn any other straightforward tools already available, but not mentioned by my leaders and senior members.
One note: my version of audacity shows the Amplitude in dB. But for a selection band, it doesn’t say it is the RMS value. The value serves my purpose, or should have, but left me a bit confused. I will elaborate why I was left confused.
I have just not been able to comprehend fully your explanation. Currently pondering over the part:
Mr. DVDdoug, you are very talented. Beyond my reach. But you must consider by stepping into my shoes how I might consider your suggestions that appear simple for you. I must also explain myself: supposing that I use Amplify tool for a selection to determine the current value. The dB shows a value, say, 13 dB. So my confusion was: is this 13 dB the Square root of the Mean of The Squared Amplitude of the peaks and troughs of the sound profile within the selection? That is, the RMS value of the sound profile within the timeband?
For illustration, In a pure Sine wave of amplitude A₀, the RMS value for a complete cycle is 1/√2 times the A₀ of that wave, or roughly 0.707 times the A₀. Since intensity is the square of the amplitude, i.e., A₀², P₀ = A₀² is then essentially the peak power.
Now, in our case the maximum peak can be 1, the normalised value. So the RMS value for a complete sine cycle would be (0.707)². So audio power should be 10xlog10(0.4998/1)) is ≈ 10x(-0.3011…) ≈ - 3 dB. So this part checks out.
But my question remains because of the way Effect/Amplify… tool displays the value without mentioning the value as RMS. Of course, in the course of discussion, I get to understand that this value is the RMS value.
Yes, I was thinking and processing: is it supposed to mean that this RMS is the RMS of the peaks and troughs within the selection, i.e., the peaks and troughs spread across within that time period of the selection? From the above discussion it appears it must be the case.
Moreover, your comment
Actually, the uncertainty accompanying your “or” unsettled me. Also, your statement as a whole left me confused. Could you please mathematically elaborate why “With music the RMS is typically 10 or 20dB below the peak”?
So I wanted a clearer picture. Or another tool.
Also there remains another confusion: the value shown by the two said tools don’t match. Analyse/ Measure RMS … and Effect / Amplify… show different values.