Win 10, version 1909, OS build 1863.1139\ … Audacity 2.4.2
I’m new - like Audacity very much!!! Thanks to all!!!
I capture the sound of a flute (440 Hz), one channel — Analyze => Plot Spectrum — then export to txt (Size 65536) => import into Excel.
How do I change the x axis? => spanning from 100 Hz to 6,000 Hz — want to reduce the number of data points.
How do I change the y axis to display amplitudes that are not converted to dB? — I can do this in Excel, but would like to view before exporting (or better yet, the percentages relative to max number). This accentuates the amplitudes.
I’m not familiar with the various function windows (Hann window, etc.). Is there a clear concise description with the pros / cons of the different options? I cannot find it in the manual.
Plot Spectrum performs FFT analysis, and FFT always analyzes from DC (0 Hz) to half the sample rate.
If you only want the first “n” lines, delete the unwanted lines from the text file before importing into Excel.
Do it in Excel.
The very short answer - use Hann.
Longer answer:
For most purposes the Hann window provides a good compromise between having a narrow central lobe and low leakage.
Other window types are provided for specialist use, but detailed explanation of the properties goes way beyond what users are likely to need for audio work. There’s a pretty good page on Wikipedia about window functions: Window function - Wikipedia
I understand the FFT starts at 0 Hz. I was hoping, we can set the “display” x axis span starting and ending someplace else. The FFT computations would still be accurate. Just the display does not need to start at 0 Hz. This would allow us to zoom in on a specific range of frequencies. And it would save us some editing time later!
Ditto for the y axis. Not a major handicap, but would be helpful. It would especially be useful if we could scale everything to the max amplitude = 100%.
This would provide percentages relative to the maximum - which provides a good perspective on all frequencies. I will attempt to attach an example.
Currently, the numbers will change, depending on the input amplitude. Plus many are not engineers and do understand dB numbers. This could be a choice with a radio button - the default would still be dB.
Hi Trebor, The Voxengo SPAN is many capabilities! … more than I need. I’ll think about it. Can it save numbers I could insert into Excel?
Hi Steve, Is there a way to change the upper end to 8191 Hz? Attached is a 440 Hz sine wave (65536 samples).

Setting the upper end to 8191 Hz would improve the resolution.
Short version:
The window size determines the number of frequency bands between DC and half the sample rate. The larger the window size, the more frequency bands, hence greater frequency precision.
Longer version:
The window size is the number of samples that are processed for each FFT calculation. The calculation returns half that number of results, each of which is a “complex number”. The “real” part of the complex number represents the amplitude and the “imaginary” part represents the phase. Thus if the window size is, say, 256, then for each block of 256 samples there is one FFT result containing 128 frequency measurements between 0 Hz and half the sample rate.
For 65536 there are always 32767 samples, regardless of the Project Rate — 18000 vs. 88200. The 18000 provides the most resolution. Thanks for your patience!
No, for a “Size” of 65536 there are 65536 samples in each block, and that gives 32768 frequency bins (32767 frequency bands between 0 Hz and half the sample rate).
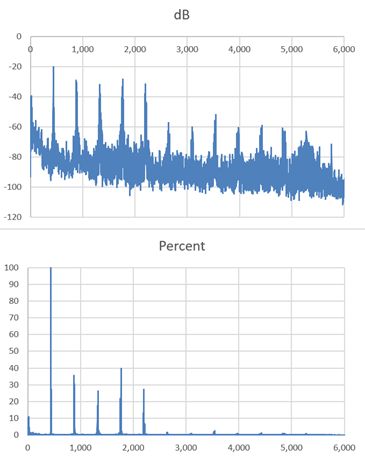
Recording a flute (440 Hz, with vibrato) with a Project Rate at 16000 results in:
The y axis is the percentage based on the largest y value.
Recording with a Project Rate at 384000 results in:

The Project Rate at 384000 combines the multiple amplitudes (of 440, 880, 1320, etc.) in the 16000.
I'm trying to extract the numbers if there was no vibrato. Any suggestions? Do I just add the peak numbers?