Since this is my first post on the forums I suppose I should introduce myself
My name is John and I am a Car Audio Enthusiast. I work in retail, but have expensive audio equipment that I am very meticulous about maintaining. Recently I’ve been getting into modifying my audio files and making them perfect for my Car Stereo System. I have found Audacity incredibly helpful.
However I have one single question about this amazing tool…
How accurate is the “Plot Spectrum” function?
I have been using this function in conjunction with Amplify and Bass / Treble to lower the overall volume of the songs I have.
I aim to achieve -6dB for treble peaks, and -10dB for the low-bass 20-100hz.
I have two amplifiers, one for my sub woofer, and one for my mids/tweets.
Mid/High amp is tuned to -6dB (any more in a track and that is bad.)
Sub woofer Amp is tuned to -10dB (any more than that, is very very very bad.)
I have them set this way because most of my music is above these levels, however some older recordings, like Sublime are around -10dB in their natural state. I like to listen to a variety of music. So I am attempting to make them all the “Same” volume so that they play right in my car.
If the Plot Spectrum function is accurate, then I have nothing to worry about.
If it’s not accurate, then I could easily blow my speakers.
So does anyone know:
How accurate Plot Spectrum is?
It does have a couple of oddities it’s good to know about.
The accuracy goes up as you drag the screen bigger and bigger. This can partially make up for the lack of Zoom.
The display depends on the settings. The Size setting can be managed for extreme accuracy at the risk of missing tiny details because they’re too fine for the screen resolution.
The log/lin setting is interesting. In Log, the Middle to your ear (about 440Hz. Oboe “A” in the orchestra) is in the middle of the screen. The middle frequency in arithmetic (Linear) values is 10,000Hz which is high enough many people have trouble hearing it.
You need to pay attention to the left-hand scale. The tool picks a new one every time as needed. I don’t think there’s any way to set it.
A word on the Size setting. We had a complaint a while back that analyzing a single pure tone didn’t give the expected sharp spike. Turns out, they had the Size setting too low and the display was sloppy, but please note that a perfect, correct display in this case is invisible. A perfect spectrum display of a perfect sine wave is infinitely sharp.
So you do have to pay attention to what the tools are telling you.
I understood most of what you said except for that…
I forgot to mention what OS I am using. I am running Windows XP Pro SP3, using the latest version of Audacity.
My max screen resolution is 1024x768. My understanding of what I read is that this could make the results a bit less accurate than if the “Size” in Audacity and if the screen resolution on my PC was higher; I would get better results?
Sorry for the confusion…
Perhaps is there a better way, or a specific program I could use to double-check the results?
The top value of the blue waves is always 100% (1.0) and the top number on the sound meters is always 0dB (unless you intentionally change them).
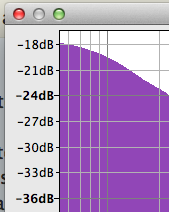
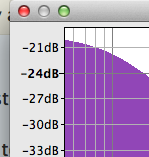
Plot Spectrum left edge runs on a sliding scale. Attached I did a Plot Spectrum on Pink Noise. One timeline show is roughly 2dB louder (taller) than the other. No other change. Plot Spectrum didn’t change except to move the left edge reference values.
We get in trouble every time somebody starts asking about surgical accuracy. Audacity is a sound and show editor, not a scientific instrument. If it’s a tossup between sounding good and perfect, bit accuracy, Audacity will pick sounds good.
I assume the peaks changed because you changed the “Size” setting in Audacity?
Or did you change the over-all size of the Plot Spectrum window by dragging it bigger/smaller?
I’ve noticed that the peaks change according to window size / the Size setting long before I joined the forums here
I just changed them until I could see the lowest (closest to -0dB) in the frequencies of main concern roughly 20-100hz.
With my max screen resolution, the size setting of 1024 in Audacity seems to work well if I maximize the plot spectrum window.
Would that make sense that this is the most accurate way to view those lower frequencies?
SIDE-NOTE:
I also have Adobe Audition CS6. The peaks in the Frequency Analyzer are WAAAYYY different even with the same window/size settings.
A track that I read at -3dB @ 40hz in Audacity reads well under -10dB in Adobe.
My initial thought was that Adobe was probably more accurate. But after playing the tracks in my vehicle, I have more faith in Audacity.
assume the peaks changed because you changed the “Size” setting in Audacity?
No. I amplified the sound sample by roughly 2dB between the measurements. All other windows and settings are the same.
That’s the oddity. Normally you would assume the spectrum would go up and down 2dB, but instead the graph reference points move. You need to know it’s going to do that.
You can get into trouble with low readings like that.
There’s something magic about very low frequencies I don’t remember very well, but the displays turn into blobs if the size is too low. Something similar happens to a vocal rumble filter popular with the audiobook crowd. That only works well with its filter length slider all the way up. If you don’t, the filter becomes sloppy and doesn’t perform well.
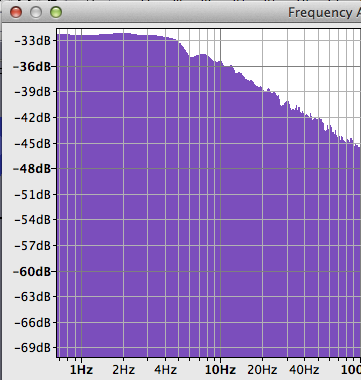
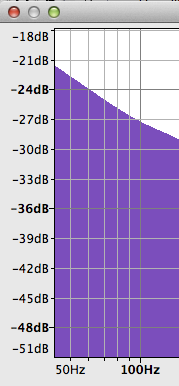
Attached Pink Noise with the size at 1024 and then the size at 65536. Note at 1024, the display system only felt comfortable down to about 50Hz or so. The analysis at 65536 gives useful readings down below 1Hz.
Click the graphics or scroll.
Also, note that the Function: Hanning Window is the algorithm used and that will change the display as you change algorithms.
I put your advice to use and tested a couple tracks:
Sample 1 reads: a 44hz peak at -11dB with size set to 2048.
Set to 1024 Reads: 45hz -10dB.
It seems to me that 1024 would be safer in my situation. As a little too much power, is a big deal.
If I judge by the information I get using 2048, my tracks would all be 1 dB higher on the bass.
Most of the bass content is very similar in my music. I throw out tracks with bass peaks lower than 38hz, and even that low is rare.
A little bit less is better than a little too much, I’m just trying to get as close to -10dB as possible without going OVER that limit.
Plot Spectrum is accurate in what it does, but interpreting the results can be tricky.
If you are interested in the gory details, Plot Spectrum performs FFT analysis (https://en.wikipedia.org/wiki/Fast_Fourier_transform) on the selected audio, which spits out a list of numbers that represent the amplitude within specified frequency bands. These figures are then normalized to show 0 dB for a sine wave that has an amplitude of 0 dB. To produce a smooth graph, the points on the graph between the discrete data points are approximated by cubic interpolation. The list of discrete numbers is available by “Exporting” from the Plot Spectrum window.
One important factor is that Audacity does not clip at 0 dB, but when you export the file (“most” audio formats), any audio above 0 dB will be clipped (chopped off) which causes bad distortion. Because Plot Spectrum is analyzing the audio data “in Audacity”, it is analyzing unclipped data even if the peak amplitude is over 0 dB. It is essential that you ensure the overall peak level is below 0 dB before you Export the audio from Audacity. 0dB is when the waveform touches the top/bottom of the track and the “clip indicator” in the playback meter lights up (http://manual.audacityteam.org/o/man/meter_toolbar.html#playback). The waveform should NOT hit 0 dB.
I had wondered whether or not using the export function gave you more accuracy. I previously tested it out, and what was shown in the graphs, at least the peaks, were the same information as in the exported text file. So I stopped using it obviously
Luckily I understand how clipping works or I’d probably have blown my amp by now with the way I like to listen to music; LOUD.
I’m also the paranoid type.
I did try exporting some songs with peaks at or right-near -0dB. In nearly every scenario, you are right, there is always clipping created. I can vouch for this.
I feel mostly comfortable with the function. Though on some tracks I feel like I’m getting a little bit less, or a little more than the readings show regardless of what window or size I use. So I guess it’s really up to knowing your system’s capabilities. Or use an Oscilloscope. Which I luckily have.
What’d be nice, is a dash-mountable oscilloscope for my situation.
Thanks for all your help. I think I’m going to do some more digging on the subject. If there isn’t a finite way to do what I’m trying to do, someone needs to make one.
I actually found out the best way to go about monitoring the actual output of your music (at least in your car) is with an Output Meter. There is this company called SMD which makes them. Pretty pricey though at $89.00. But they give you real-time accurate readings.
I could also modify my music less using the meter. Clipping in a lot of the tracks would still be an issue. But I could just normalize to -0.5 to -1dB to fix that. Much smaller change than -+3-6dB with Amplifiy or Bass & Treble as I’ve currently been using. However it seems dangerous to me to have a -0dB track in a playlist with mostly -5 to -10dB tracks.
I could just check the amplitude, and save them in different folders… but if you reach the end of the folder… it skips to the next, but it’d be a small jump instead of a huge one.
What if you forget to turn down the volume in-between tracks? You’ll blow up your speakers pretty quick or damage an amp.
It’s risky business without an output meter and the tracks all about the same amplitude in an SPL or concert system. I don’t trust that I won’t forget every now and then.
I also tried out a lot of phone RTA app’s. Very cool stuff out there some seem to work pretty well. Not sure how accurate it is on my Galaxy S4 Active. But it was certainly worth looking up
In conclusion, the Output Meter makes the accuracy of Plot Function unimportant.
If you blow good amps with clipping, your gain staging is probably wrong. No meter will protect from that, let alone an spl based meter. You might learn something from looking at the light show, but you still need the basics in knowledge.
Every device in your reproduction chain should be at its normal working level, without adding gain that isn’t needed. Having to much gain will blow amps or speakers, but will also make the signal-to-noise ratio worse than it needs to be. It will add a little bit of distortion too, but you usually can’t hear that, even in an almost silent room.
You need to do that with analog gear, but also in the digital domain. You won’t add noise, nor distortion, but you’ll get closer to clipping in the digital realm. And digital clipping often results in 100% distortion at 100% output level. Bad for you ears if your gain staging is correct. But even worse for your ears and your gear if you have too much gain.
If you have good gear, adding enough devices/amplification to the chain will eventually also produce oscillation. Blows tweeters and can be very hard to troubleshoot if it’s intermittent and over 20 KHz at full power.