Help to Analyze and Plot spectrum in Audacity

Hello,

I got some uncompressed wav sound files that has been recorded with recording equipment that are pretty linaer up to 100 kHz, samplingrate was 200 khz.
I am mostly interrested in the ultrasonic part of the spectrum, around 15 kHz to 90 kHz, and i have used the Plot Spectrum function under Analyze in Audacity.

Here is my question, why do the high frequency part of the spectrum disapear when i raise the valus in the “Size” field, when Size is ea 512, i can see the frequency plot all the way up to around 90 kHz, but if i set Size to ea 16384, i can only see the frequency plot only up to around 35 kHz. I understand that the higher Size gives me more resolution, but why limitation in the high frequencies, and most omportant, how do i choose the right “Size” number for my interrest in the frequency range 15 kHz to 90 kHz?
I have attached two plots where the only difference is the number in the “size” field.
512.jpg
16384.jpg

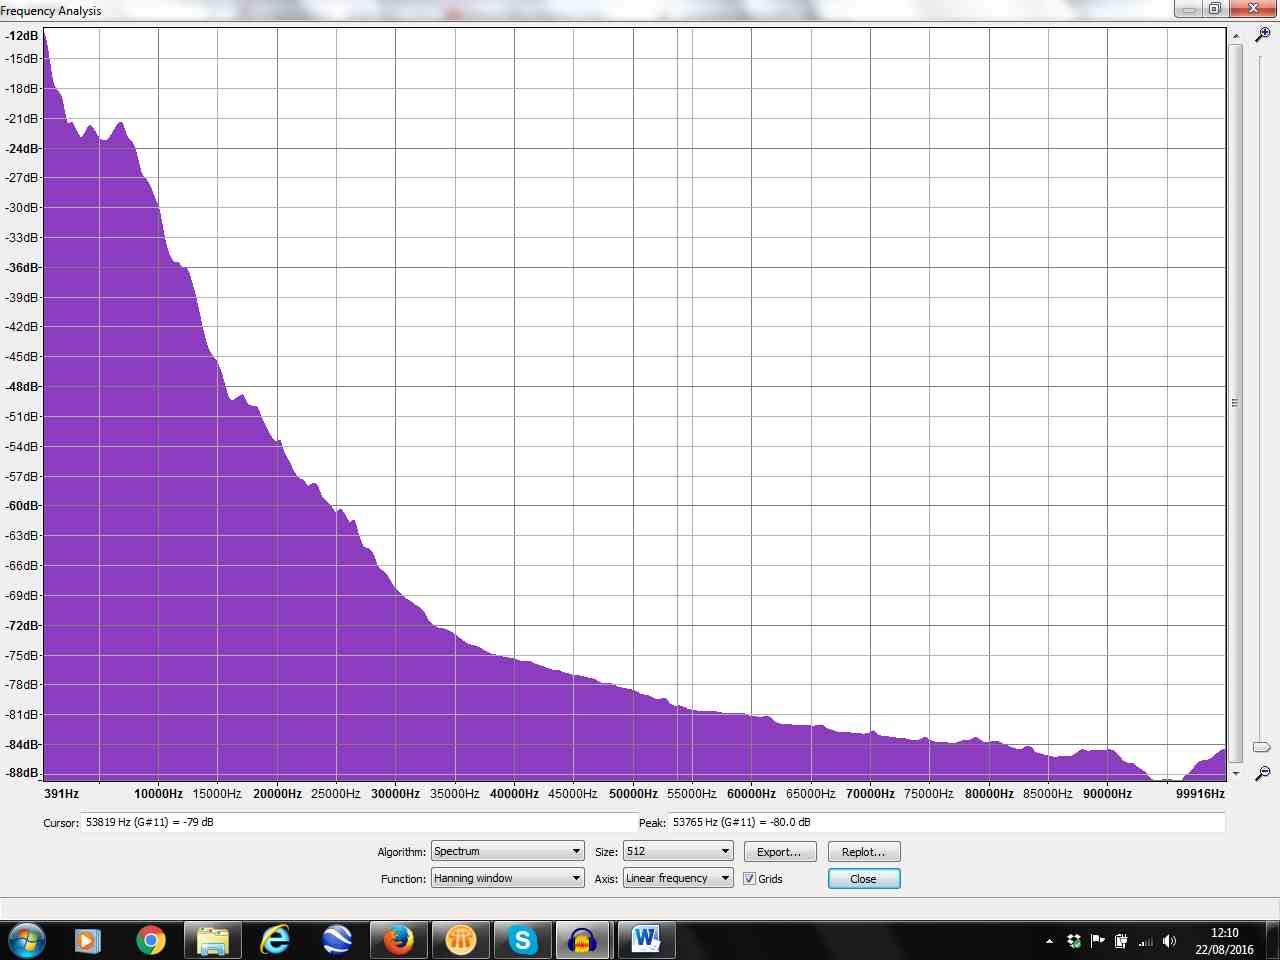
If you look at the vertical scale, you will notice that in both cases they are going down to around -90dB.

One way to think of the FFT algorithm (on which the spectrum plot is based), is that it splits the full frequency range into a number of equally spaced “bins”. So, as a silly but easy example:

  • If the sample rate is 1600 Hz, then the frequency range is 0 to 800 Hz (from DC, up to half the sample rate)
  • If the “FFT Size” is 16, then the number of “bins” will be 8 (the number of frequency bins is half the “Size”)
  • Each “bin” catch frequencies that are within equally spaced frequency ranges…
  • The frequency ranges will be: 0-100, 100-200, 200-300, 300-400, 400-500, 500-600, 600-700, and 700-800Hz
  • The signal is divided between these 8 bins according to the frequency components of the signal

If, for example, the signal in this scenario was white noise, then we would expect the same “amount” to be in each bin.
Now what would happen if we have twice as many bins? Each bin would now cover a frequency range half the size, so in the above example, rather than catching frequencies that lie with a 100 Hz range, each bin would now catch frequencies that are within a 50 Hz range, so as we would reasonably expect, they will usually catch “less stuff”. In the case of white noise, for an FFT Size of 32, there will be 16 bins, so each bin will now catch only 1/16 of the noise rather than 1/8th of the noise.

One final point about this: If the signal contains a pure sine tone, then no matter how small the bins are, the entire signal should fit into one bin. (In practice it is more complicated because there is ‘leakage’ between bins, and there are edge cases where a tone may be on the boundary of two bins).

The measurements (vertical scale) in Plot Spectrum is such that a 0 dB sine wave should produce a 0 dB peak.


Back to your case.

With increasing FFT Size, the bins are smaller, so each bin catches less. The problem in your second (Size = 16384) image is that the high frequency bins are catching so little that they are off the bottom of the scale (less than -90 dB).

If you are not interested in frequencies below, say, 5kHz, then you could use the Equalization effect to reduce those unwanted frequencies (a lot), and then amplify the remaining signal. That will hopefully bring those high frequencies into range for Plot Spectrum. (I’ve just got my fingers crossed that the “magical auto scaling” does not mess this up for you). Try this, and post a screen shot to let us know how it goes.

Hello Steve,

Thank you so much for explaining to me in a very constructive way, that is what i need! :slight_smile:
I will need to read your answer a few times to understand, and I will try to do the equalization you suggest.
In the meantime, it is still a bit strange to me that the high frequency energy, in my sample, depends on this “size” setting, i mean how can you then count on what is right or wrong?

I mean, in the plot with size set to 512, i have around -84 dB sound level from 80 kHz, but with window size 16384, i have far lower sound level at 80 kHz, on the same sound sample…I mean, the sample is the same in both cases…so how do i know what is right…sorry, i know… i need to understand the concept of FFT, but i just find this strange.

BR
Martin

Try picturing it as physical “things” rather than "frequency components:

Imagine that you are collecting berries from a bush and you have several baskets to put the berries in. While you are picking the berries you sort them according to size, so, if you have 3 baskets, then you put the biggest berries in basket #1, the medium berries in basket #2 and the smallest berries in basket #3. When you have picked all of the berries from the bush you can count how many berries are in each basket.

Now imagine that rather than 3 baskets you have 6 baskets, and again you sort the berries according to size: biggest in basket #1, next biggest in basket #2 and so on up to the smallest berries in basket #6.

Assuming the same number of berries in both cases, it’s obvious that when you have 6 baskets, there will be less berries per basket than when you have 3 baskets.

A similar thing is happening with FFT analysis - the more frequency “bins”, the less will be in each bin.

Does that help?

Perhaps mtolesen is asking for Normalization presets?

Gale

Hello Steve

Again thank you very much for explaining it in the other way, this for sure, help me in understanding!, very good explanation for a rookie like me, I think I now start to see what is going on.
I will play a bit more with Audacity, and my samples, and if ok, I may have some more questions as they come.
Again, thank you very much.
Br
Martin