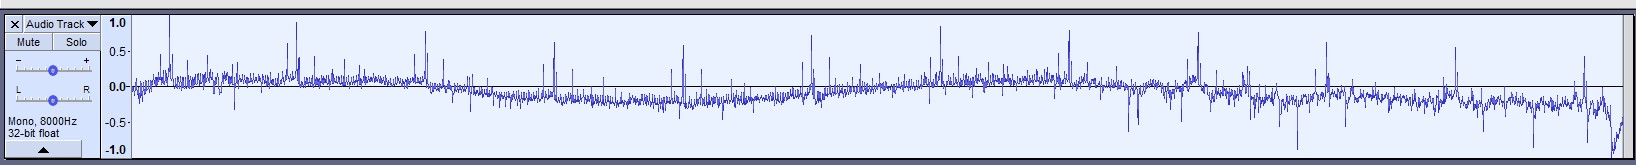
I ran across an interesting dataset, consisting of a list of about 4000 numbers. Plotted it out it has an interesting pattern that looked a lot like an EKG heart tracing. I thought it would be interesting to “listen” to the numbers. I have so far been unsuccessful, but the closest I have gotten is using Audacity and importing a .txt of the numbers, normalized to between -1 and 1, using the Sample Data Import function. It gives a track that looks like this:
But it’s obviously very short, from 0.1s to 0.5s depending on the Hz I set. What I expect to hear is a general scratchy undulating tone, with periodic high pitched blips, all becoming noisier and lower pitched at the end, hopefully lengthening it to about 10 seconds. I have tried changing speed and tempo, but that changes the way it looks entirely, and does not sound as expected, when I have been able to generate sound at all…
Here are the numbers Normed to -1 to 1.txt (64.6 KB)
if anyone is interested in looking at them, but I hope to have an updated data set soon and would like to learn how to do it so I can use it with the new numbers too.
Please forgive my near complete lack of understanding of all things audio. I have tried looking through the forums and while people have done similar things, nothing they have done has worked so far. Thanks for any guidance,
J
I’ve uploaded your attachments to the forum as that is more convenient for people reading the posts and avoids dead links in the future.
I would expect that to sound like a short “buzz”.
I can see how you come to that idea, but that’s not how audio works. I think that you are visualizing the waveform like a graph with frequency on the vertical axis and time on the horizontal axis.
It would be possible to convert the data set to “frequency against time” with a bit of programming in Audacity’s built-in scripting language “Nyquist”. First you would need to convert / normalize the data to a suitable range. To convert to frequencies, 0 to 10000 (Hz) would be suitable, or if you want a more “musical” result you could use an integer range of MIDI Note Numbers.
Where is the data from and what was the original range?
Would it make more sense to take absolute values rather than signed values?
Would it make sense to reduce the data to a relatively small number of integer values?
Would it make more sense to distribute the data on a logarithmic scale rather than linear scale?
Here’s an example of the kind of thing, using a small data set to represent frequencies. This can be run in the “Nyquist Prompt” effect
(Nyquist Prompt - Audacity Manual).
Lines beginning with semicolons are comments.
The first two comment lines tell Audacity to treat the code as a version 4 “Generator” plug-in.
;version 4
;type generate

;; Example data set. For a large data set the data should
;; be read from a file.
(setf input (list 1000 900 700 300 400 200 400 200 250 300 350 400 500 700 1100))

;; Time per step (seconds)
(setf step 0.1)

(setf data ())  ;an empty list
(setf time step)
(dotimes (i (length input))
  (push (nth i input) data)
  (push time data)
  (setf time (+ time step)))

;; Remove the last time value and then
;; reverse the list back to chronological order.
(setf data (reverse (cdr data)))

;; Generate a sound from the list of data
(mult 0.5
  (hzosc (pwlv-list data)))