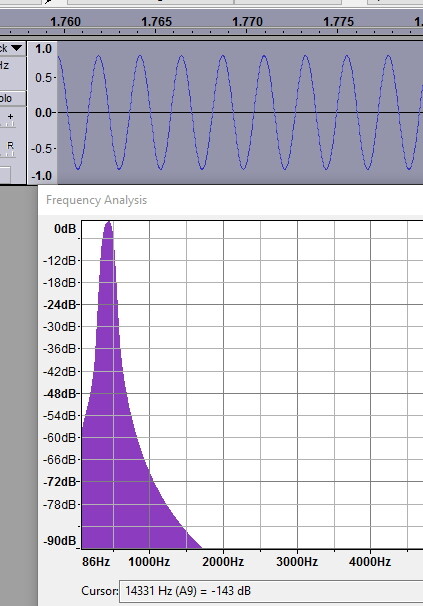
I want to calibrate my HP iPAQ audio using a 440Hz sinewave tone generated by Audacity. I recorded the tone and on timline expansion I can clearly see that it is a Sinewave. Then in Audacity I selected frequency analysis of this waveform.
The result is
Would someone explain why the frequency analysis waveshape shows frequencies either side of 440Hz. A pure sinewave does not have harmonic frequencies.
Those aren’t harmonics. That’s just sloppy analysis. Crank up the “Size” value as far as it will go. You may also need to pull the analysis window wider to see it.
Plot Spectrum analyzes the frequency content using FFT (Fast Fourier transform - Wikipedia)
Basically how it works is to split the sound into lots of frequency bands. The number of bands is set by the “Size” setting (the number of frequency bands is half the size of the FFT table). Due to “edge effects”, there is some “leakage” between the bands, which can be controlled using a technique called “windowing” (Window function - Wikipedia). The default “Hanning” window (“Hann window”) is usually a good choice.
By increasing the FFT “Size”, the number of frequency bands is increased, giving finer frequency resolution.