So I’m working on a project in which I’m trying to reduce the overall SPL of our mechanical system. I have a simple radioshack SPL meter to give me an average dB reading. However, I would like to find the dominant frequencies in my system, thus I downloaded Audacity (the newest version from FileHippo.com). I’ve recorded my system and when I use the “Plot Spectrum” feature in the “Analyze” drop down menu, all the dB readings are negative. From other postings that I’ve read in this forum, I’ve gathered that the dB displayed in the plot cannot be directly correlated to the dB reading on my SPL during my tests (I ran both simultaneously). However, is there a way to use the spectrum plotting feature to determine what frequencies are relevant at my dB level? I have no experience in the audio field whatsoever so I’m pretty much learning as I go. Thanks for any help you can give.
“C” is more or less flat. We need to know whether you are dealing with law enforcement or not. Curve C is a snap to manage and measure. Curve A is a good deal less so.
db will be negative!
all relative to absolute loudest digital can be
but all are still relatively correct to each other
the peaks on the display show the freqs that are loudest
the spl uses a weighted average of all of them
but as a rough guide - the loudest (tallest-least down) add the most
so if you have big peaks you gain a bunch by fixing them
if its all relatively flat you need to lower everything
and of course
adjust that advice by the weighting curve if you need it
some freqs may be more annoying than others for
human hearing ability and psychology reasons
He’s right. Digital Audio is measured from maximum possible and always goes down. Maximum possible is 0dBFS – zero dB Full Scale. Standard reference broadcast tone in the US is -20. In the UK, it’s -18. the numbers always go down. Higher than 0 is where your computer explodes or other very nasty evil things happen.
Sound Pressure Level, I believe can go both ways, but it doesn’t make any difference. If you do something and a particular peak in the spectrum analysis goes down 6dB, then the sound energy at that frequency will go down by half. This is the singing bad bearing or whining compressor thing.
This is where experience counts. Knowing what each frequency sounds like is a big deal. This is an engineering joke. Two engineers listening to a broken motor screaming. “3500 Hz,” says one. “More like 5000 Hz,” says the other. Then they run for the analyzer to find out who has to buy the beer. Usually, they leave the motor to burn up.
Just when you’re feeling fuzzy-warm about all this. What are you using for a microphone? They all have frequency lumps and bumps, too. Your Radio Shack meter should have an audio output on the side.
The microphone we are using is called a Rode NT1 I believe. So if I have a waveform spectrum and say I do something to our system that quiets it. If I were to plot the spectrum and if the the 500Hz peak was initially at -27dB but is now at -37dB, I’ve effectively reduced the SPL by 5dB?
When I was playing around with the settings in Audacity, I did Preferences>Interface>Meter/Waveform dB range and set it to -120dB (Approximate limit of human hearing). Do I need to even adjust this setting? Intuitively, to me anyway, none of the other settings seemed like they needed to be changed. Although, like I said I really don’t know what I’m doing. I changed it because I wanted to make sure to record all relevant frequencies within our range of hearing. Changing this setting seems to have some impact on the reference value in the Waveform Spectrum plots. Is this adjusting the reference pressure used in Audacity’s dB calculations or something?
Here’s a plot of one of my recordings. It looks to me like the dominant frequencies are between 300 and 600Hz and then less than 200Hz with some less-notable spikes elsewhere in the spectrum. Generally speaking, the nature of the frequencies seem to tail off as the frequencies increase.
That tailing off thing is suspicious. Nature doesn’t do that. There’s something in the sound pathway that’s producing an artificial droop.
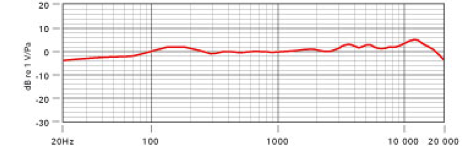
The Rhode isn’t really flat and you have to factor in the lumps and bumps of its response.
Stand in front of the running system with a sheet of newspaper and crumple it up. Be careful not to overload the sound channel. Do an analysis. That should produce measurable energy out to 20KHz.
So when I’m taking recordings to analyze, I should have a crumpled up sheet of news paper behind it to ensure you don’t have odd droops and changes in the spectrum from random reverberations? Should I change that preferences setting of the meter/waveform db range to -96 dB then instead of the -120? the next setting after -96 is -60 so I need to make sure I keep all the relevant frequencies in my spectrum, if that setting is even doing what I think it’s doing.
Here’s that same recording with the highest sampling rate. It looks significantly more flat after I increased it.
Oh, and I also changed the window from rectangular to Hanning since I saw that in your spectrum Koz. Is that the generally accepted window to use in the industry?
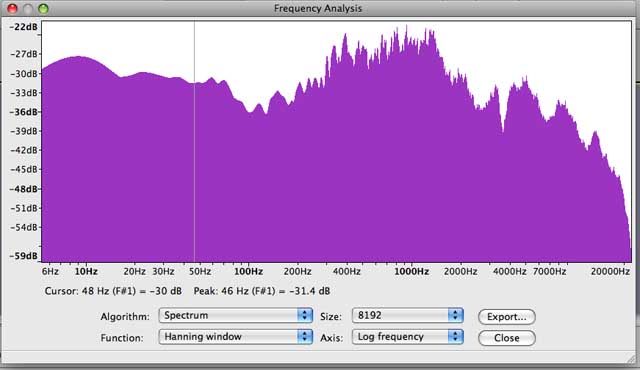
The crinkling newspaper is a handy test to make sure there are no odd problems in the system. This is the spectrum of a Blue Snowball USB microphone during the newspaper test.
Note it has significant energy beyond audibility both directions. 20 Hz to 20000 Hz. I wondered for a long time how to cheaply generate acoustic test sounds that would reliably produce a broad spectrum of sound. Turns out The Los Angeles Times print edition isn’t too awful.
<<<Oh, and I also changed the window from rectangular to Hanning since I saw that in your spectrum Koz. Is that the generally accepted window to use in the industry?>>>
I use the default. I don’t think the default is rectangular.
I do the newspaper test on my feather duvet over the bed in my heavily carpeted bedroom. Not many sound reflections or echoes, so I get pretty much whatever the microphone feels like giving me.
Different tasks demand a different “size” number. If all you’re interested in is overall general groups of sounds, the large surgical 8192 or higher number is a waste of time. If you’re looking for that one pitch tone in a forest of other tones, then a higher number is for you.
And just because I haven’t been a wet blanket in several days, all these measurements depend strongly on the accuracy of the sound card. The one that came with your computer probably cost the manufacturer 14 cents. We get postings from people that not only are pitch recordings off, sometimes whole tempo presentations are off – enough so to be significant in a three minute performance.
You should invest in a nice tuning fork or other acoustical standard and measure that first.
I wonder if I can get into trouble here. Generate a number of specific tones in Audacity and burn them to a Music CD. Play the music CD to a speaker system and measure them. See if they appear where you put them.
You can also use the power mains. Touch one of the audio connections on your computer…
Record the buzz. In the US, you should get significant peaks at 60, 180, and 360. The frequencies are very accurate because of the interconnected power grid.