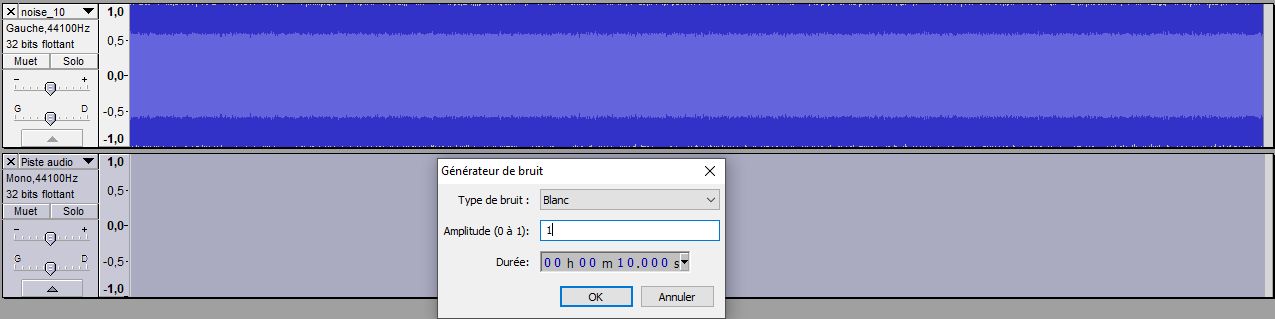
Hello,
I’m working on a white noise, generated with Audacity:
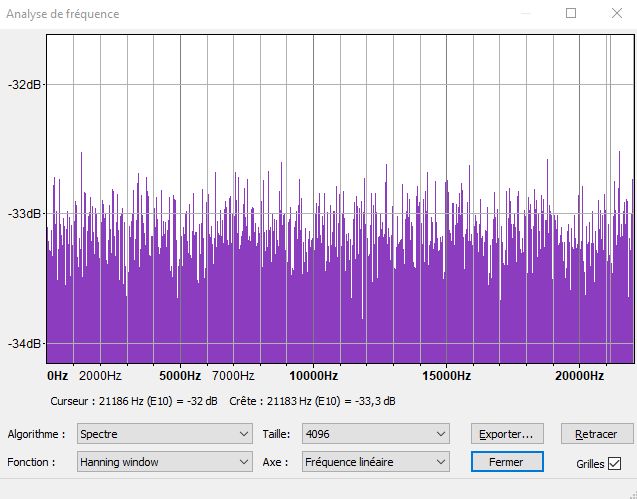
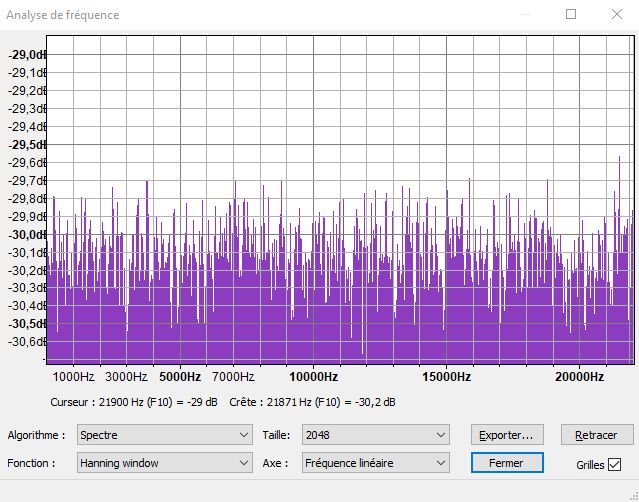
Then I need to analyse the spectrum, and I notice that the result is depending on the window size.
At size 2048, level is around -30 dB.
At size 4096, level is around -33 dB.
Basically, when I double the window size, the level decreases by 3 dB.
However, with another signal (e.g. sine) the level stays consistent whatever the window size I chose. A full scale sine [-1;1] will return a spectrum level of 0 dB no matter what window size.
“Plot Spectrum” uses FFT analysis, which basically splits the sound into multiple “frequency buckets”.
For a pure sine tone, all of the sound will be in one “bucket” (or in the special case, on the border between two buckets). The graph is normalized (scaled) such that a 0 dB sine tone will measure (approximately) 0 dB in Plot Spectrum.
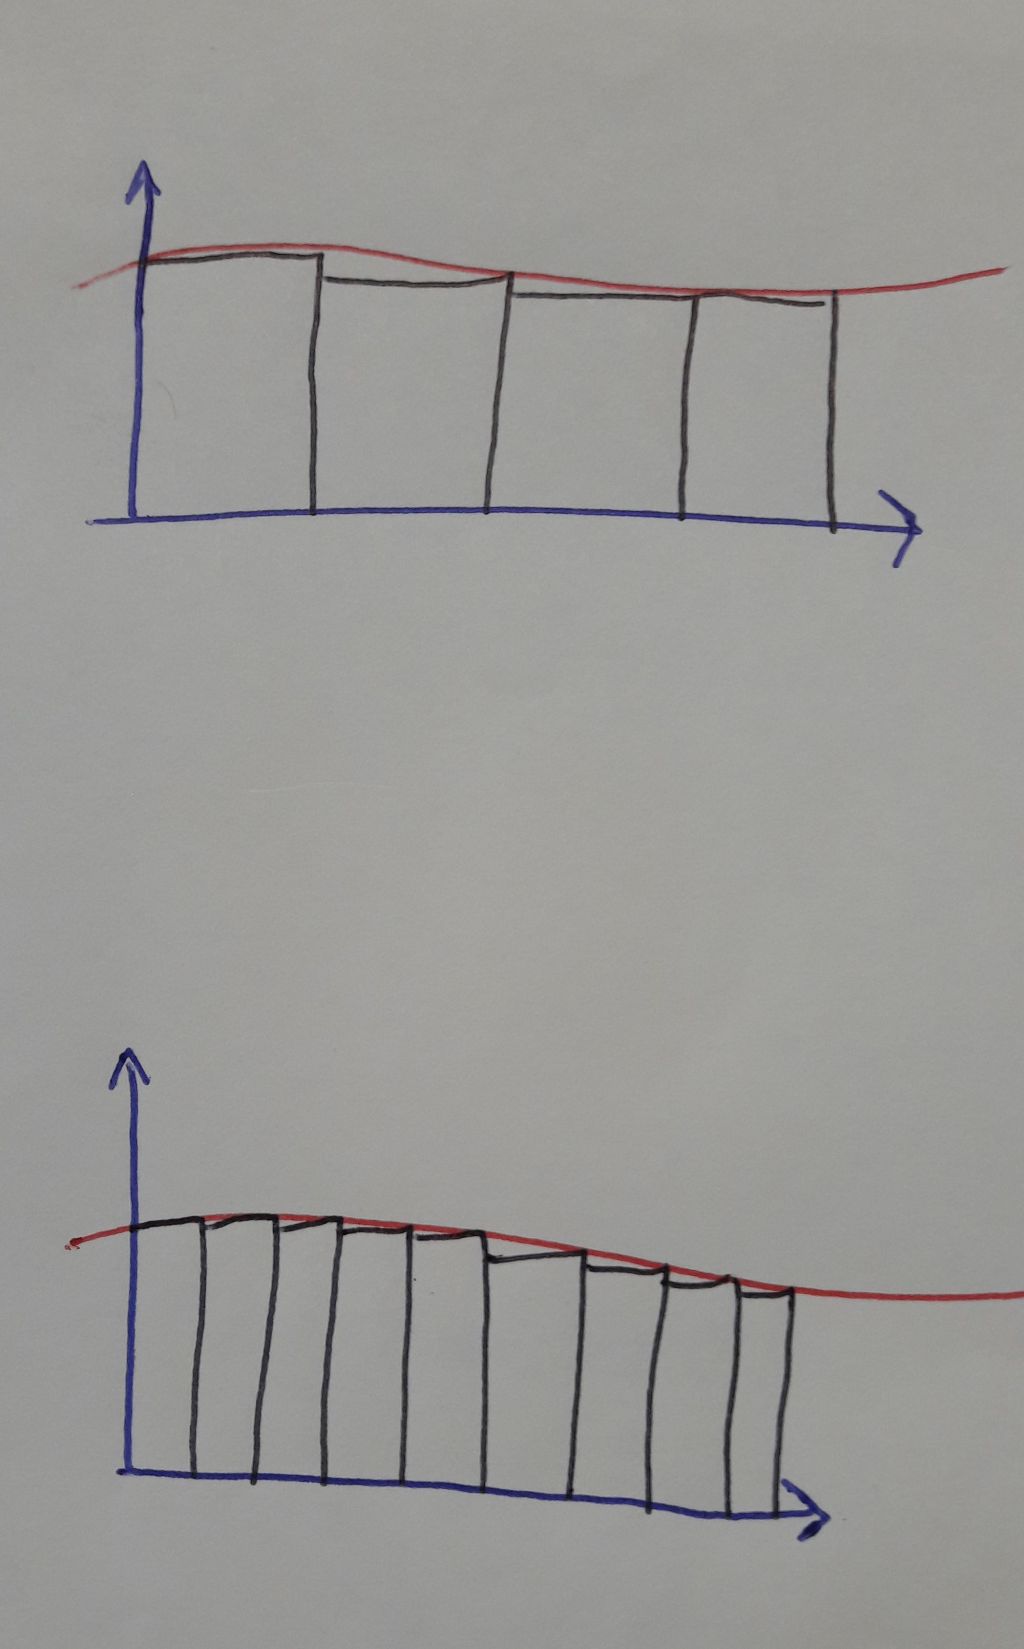
For white noise, the audio is distributed approximately equally across all of the buckets. The number of buckets depends on the “window size”. If the window size is doubled, then the number of buckets also doubles. Thus, each bucket contains only half the “amount” of sound because the sound is being distributed across twice as many buckets.
“Plot Spectrum” shows the “sound intensity” (power). Doubling the sound intensity is an increase of +3 dB. Halving the power intensity is a decrease of -3 dB.
I agree with you, but in White Noise, every frequency is supposed to be present in a approximately equivalent amount. Increasing the total amount of bins and dividing their by two, should do the same on the “sound” contained in them.
The same way we calculate approximate integrals, the value stays basically the same after changing the bin size.
But if you do that, then you will also scale sine tones and a 0 dB sine tone will have a different level depending on the window size.
You can of course export the raw data from Plot Spectrum, and then plot it any way that you want to. I was just saying how Audacity (and most other audio apps) plots it.