I have a specific question about the graphic, which Audacity draws, but if anyone is willing, to answer more questions, for educational purposes, he is welcome.
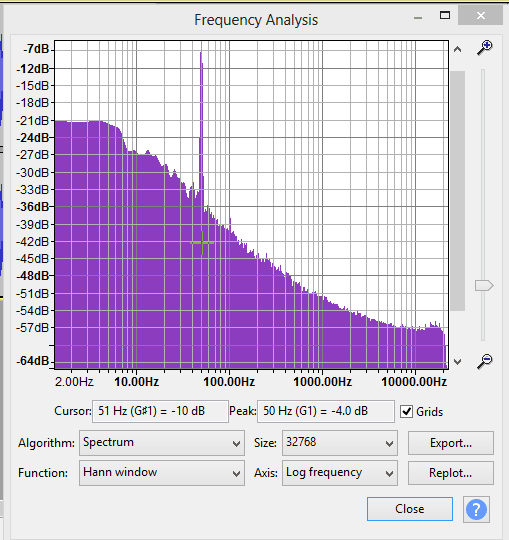
Q: What is the meaning of the “slope”, marked with green, on the image bellow?
I have a specific question about the graphic, which Audacity draws, but if anyone is willing, to answer more questions, for educational purposes, he is welcome.
Q: What is the meaning of the “slope”, marked with green, on the image bellow?
I’ve never seen that before but it’s a straight-line approximation of the spectrum.
Is that pink noise?
seems like there is misunderstanding.
the green line is drawn by me. i am asking, “why the graph has that slope-like representation?”.
why 20000Hz is at -108dB, but 5Hz is at -66dB? 40dB of loudness difference, why?
is that the actual thing, that my hardware has recorded? lows being loud, highs being like not-present?
is it my hardware capability?
is it the way FFT works?
the graph in audacity manual has similar slope, too. why the slope?
is it pink noise? idk if that is a joke, im not in a mood for jokes.
obviously not a pink noise, despite the color representation, being somewhat pinkish.
this is a sample recording, of the constant noise in my home, which nobody, but me cares for and its hurting more, than just my sense of humor. im fighting a war, for my survival and i need to understand, what my hardware is “hearing” and if it is the same, as what i am hearing(or something like that. i cant think straight at the moment. its 0100 hours and this noise is unbearable). this fa is clearly showing present noise, far louder than the background.
and here again, why the background is not level, but a slope?
im aware, that hardware does not have level capabilities, but this slope is something else. or maybe it is not?
maybe this is a common hardware limitation - being more sensitive to lows, than highs?
i hope, you understand my frustration and the eventual nonsense, that i might have written. im not here to troll, or hurt your feelings.
So you can get get a roughly similar frequency analysis shape by generating a chirp, sine, 4-20000, .9-.1, Logarithmic. It means the stronger the signal, the lower the frequecy and the higher the frequecy, the quieter it gets. Or the amplitude is inversely proportional to the frequency. And since you are measuring in dBs, I think it also means the log of the amplitude is inversely proportional to the log of the frequency. I’ll let the mathematicians step in here.
You will also get the same frequency analysis with pink noise, as you mentioned.
Also note that higher frequencies have inherently higher energy and I believe have a greater attenuation as they travel through things than lower frequencies, so you may just be discovering one of the universal characteristics of noise.
Do an internet search on pink noise.
Pink noise isn’t a joke. ![]() I don’t know exactly where the name comes from but white noise is random and it contains all frequencies equally (or with equal random-probability) just as white light contains all colors/wavelengths equally.
I don’t know exactly where the name comes from but white noise is random and it contains all frequencies equally (or with equal random-probability) just as white light contains all colors/wavelengths equally.
Pink noise is white noise filtered to drop-off by 3dB per octaveas the frequency goes up. It has a spectrum similar to music or “natural noise” and it’s commonly used in audio testing (like if you want to test the frequency response of your speakers in your room).
Well, that’s pretty-much what you’d expect from “natural noise” but your sample is almost too-close to perfect!
why the background is not level, but a slope?
Because reality is not level. It’s easy to find something vibrating a few dozen to a few hundred times a second (your voice, car noises, rustling leaves, wind noise). But it’s hard to find something that’s vibrating thousands or tens of thousands times a second. Most of this is quieter overtones of lower frequency stuff, together with the occasional dentist tool or mouse squeak.
That frequency-response is the innate unavoidable noise generated by all electronics.
If you unplug the microphone you’ll still get the same wedge-shape …
If nobody else can hear it, tinnitus is a possible explanation
If it is tinnitus it would not be confined to your home: any quiet room would do.
thank you for your replies and not getting mad, at my mad reply.
i do not have tinnitus. everyone can hear it. its that they do not care. i can argue about “the perception of sound when no corresponding external sound is present.”, but that is another topic. it was already said here, that silence does not exist in nature, let alone the radio-polluted environment, humans created. there are many “made-up” medical conditions. and the conditional “sound” could be caused by many things, as simple as fatigue, from exposure to loud sound.
based on the replies, id assume, i have good hardware, potentially quiet home and the “slope” is how it works. and last but not least, there is obvious, loud noise above the background(recording is 24/96, sources are 3+ meters away).
right?
@Rob How do you record this nomic? when i set my mic volume to 0, i get 0. unplugging… here is the graph for unplugged, not slopey, id say:
Is a form of tinnitus.
Some devices / software correct for the slope …
The key point is there is unavoidable electrical noise in all hardware, no matter how expensive. The peaks poking out of that noise could be audible noise in the room, but if they are integer-multiples of your mains electricity frequency, (60,120,180Hz … 50,100,150Hz …), they’re likely to be electrical in origin, not acoustic.
The famous censor bleep is 1000Hz. Is what you perceive higher or lower in pitch that ?.
haha so the slope is a thing. is adjusting that, something like dynamic range compression?
i do know the exact source, of most of the noise. its humans, making it. i said enough of the story. i dont feel like it is appropriate, to share more in here. if anyone feels capable of making (big) things happen, like moving a mountain, id be asking for a bit of help, though.
otherwise i am just curious, how loud the noises are, according to what the hardware is recording. and that slope is confusing.
i need to experiment, by playing and recording a high and a low frequency, with the same volume, and observe, what is drawn.
No, it’s just the natural nature of (most) sound. Somewhat related - Tweeters can’t handle as much power as a woofer. And that’s OK because music and regular program material contains more energy in the lower frequencies.
And if the sound is coming from the outside or from the neighbors and through the walls, the walls tend to act like low-pass filters allowing low frequencies through. When you hear the neighbor’s stereo, you usually hear the bass.
Your soundcard/microphone (or whatever you are using) is not calibrated. The digital dBFS levels in Audacity are directly correlated with, but not calibrated with, the dB SPL loudness in the room.
To measure loudness you need an SPL meter.
But did you say it’s very-quiet and nobody else is hearing it? Or it’s just not bothering anyone else? Most “home” SPL meters don’t go low enough to read very-quiet sounds.
In Audacity you can use Generate → Noise or Generate → Tone. You can generate white, pink, or brownian noise.
If you want to generate a single pure-tone without harmonics, generate a sine wave.
You might want to play some white or pink noise in the background to drown it out. Or, some nature sounds (rain or waves) or music or the radio, etc. …If those sounds are less annoying to you.
P.S.
Real-world sounds are more than one frequency-pitch. A guitar and trumpet playing the same note sound different because of the different harmonics.
The human voice covers most of the audible range. You can throw-away the highest & lowest frequencies but if you filter it too much it sounds unnatural and/or you loose intelligibility.
P.P.S
Your ear is most sensitive to frequencies around 3KHz. (Equal Loudness Curves)
SPL meters usually have something called A-weighting which approximately matches our hearing.
This topic was automatically closed after 30 days. New replies are no longer allowed.