I am analyzing audio from my Police and Fire Department scanner, whenever a fire station is dispatched, you will hear two tones that each have their own distinct frequency. I was able to use the Analyze>Plot Spectrum function on a sample of the tone to determine what the frequency is, roughly 452Hz, but now that I have that, how do I actually find out when it occurs on the timeline? The recording is 8 hours long. I just want it too highlight / show all of the sections where it occurs. There is a ton of noise though… What’s the best way to do this? Right now, I’ve been finding it by changing the track view to Spectrogram and just looking for the straight lines of the tones…
That’s a perfectly valid way to do it.
Another is to duplicate the track, then use a notch filter to remove the tone, then “subtract” the filtered track from the original. How well this works depends on how accurately you have measured the tone frequency, and how loud the tone is compared to the noise.
To “subtract” the duplicate track from the original, apply the “Invert” effect to the duplicate track, then “Tracks menu > Mix > Mix and Render”.
The narrower the notch filter frequency the better, but it is essential that the tone frequency lies within the notch.
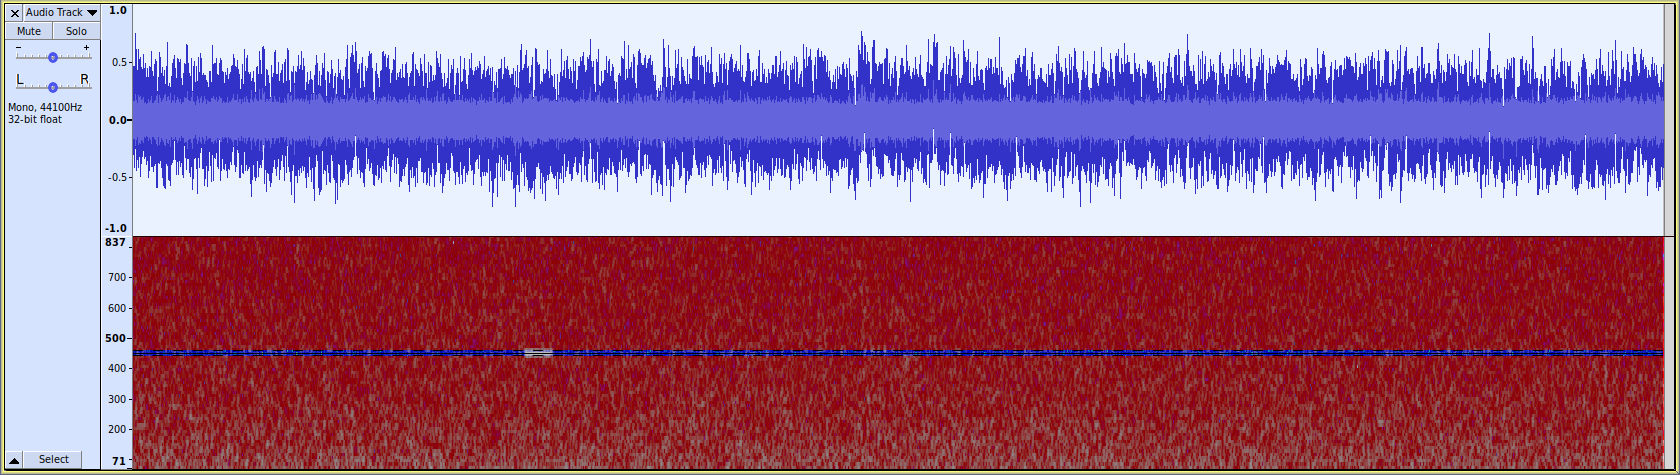
Here you can see a short tone at exactly 452 Hz within a mass of noise:
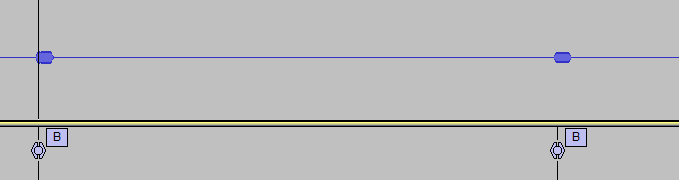
Here I’ve made a “Spectral Selection” that covers the tone frequency and extends from the start to the end of the track:
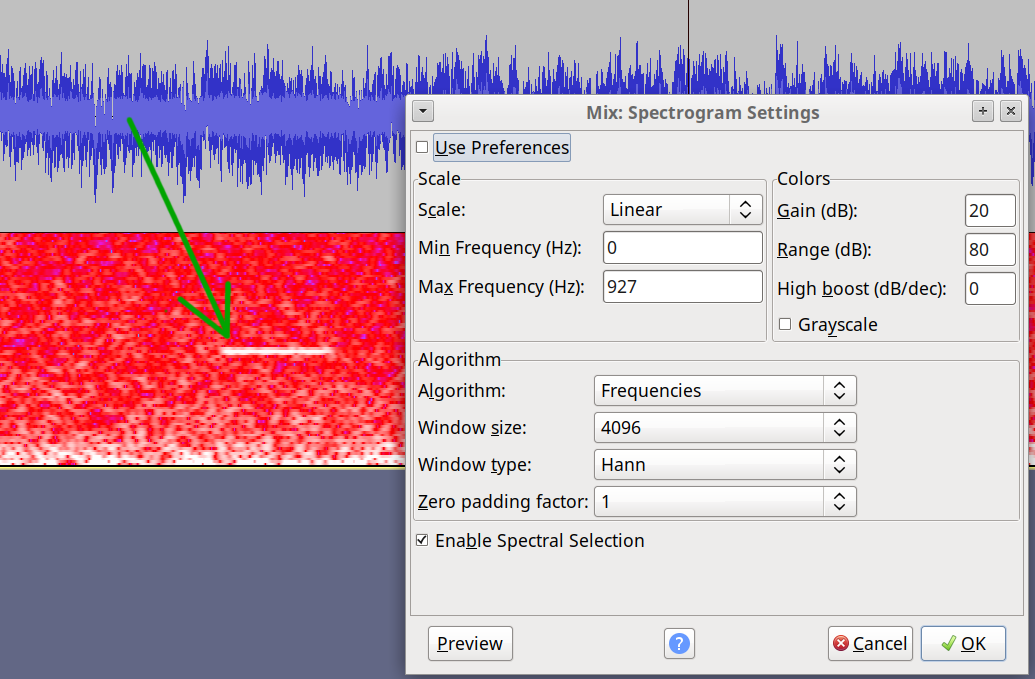
I then used the “Spectral Delete” effect to delete the selected frequencies (effectively a very precise notch filter).
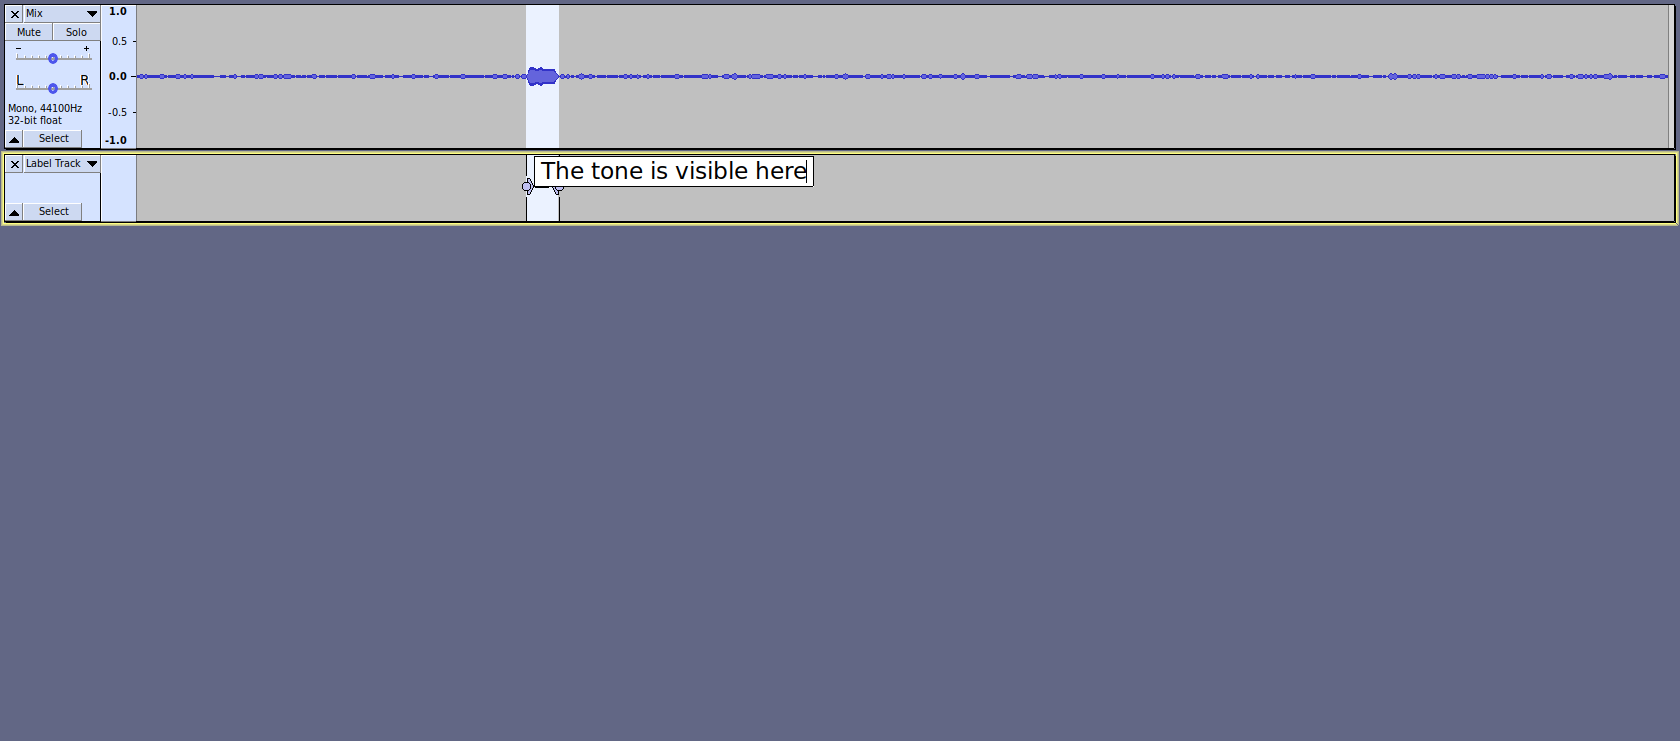
And this is the result after inverting and mixing with the original:
Bumping zombie because it is extremely useful and one of the two returns when searching da “google” for:
“Audacity split file on tone”
Using the described GUI technique you are left with something like (attachment) which is very very useful starting point for doing stuff.