I need to store spectrograms of audio files generated as images and export those images. How can I do it in audacity??
Spectrogram view can be selected in the track drop-down menu: http://manual.audacityteam.org/o/man/track_drop_down_menu.html
To print the track, use the “Screenshot Tools” in the Help menu: http://manual.audacityteam.org/o/man/help_menu.html#tools
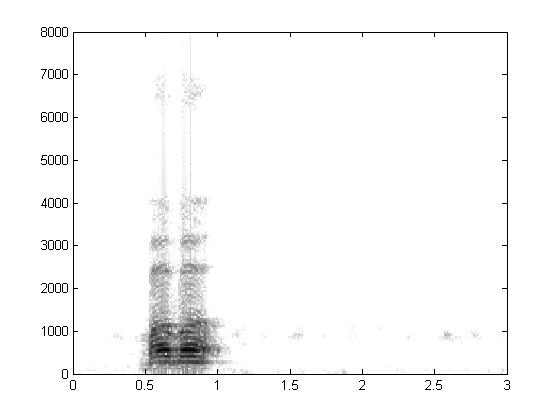
I don’t want it like a screen shot. I want it like a graph. I am trying to match spectrograms of same audio files using Image processing techniques. For that I need to have a common axis for the spectrograms.I want to extract those spectrograms like the image that I have attached below
Sonic Visualizer may be better suited to your needs: http://www.sonicvisualiser.org/