Here’s a cute hack… generate a graph as a waveform in an effect. Duplicate some audio and apply an effect to it.
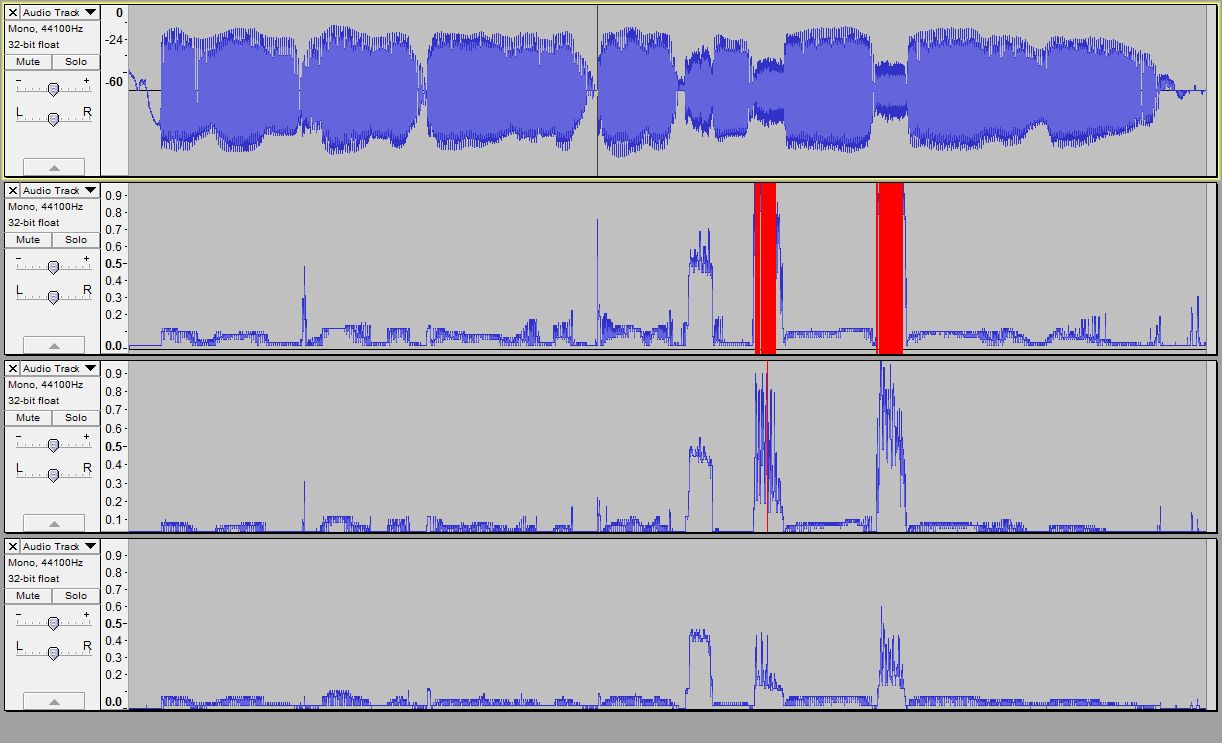
Here is me saying “a long time ago in a galaxy far, far away” in a monotone. And graphs showing the frequencies that mark the 75th, 50th, and 25th percentiles of the power spectrum, with 1.0 corresponding to 10 kHz.
And the code that did it.
Warning, there is a small bug I haven’t fixed. I don’t understand yet exactly how many frames snd-fft makes from a given number of samples. More than truly fit for the given length and step? Padding at the edges of the selection? MakeGraph.ny (3.79 KB)
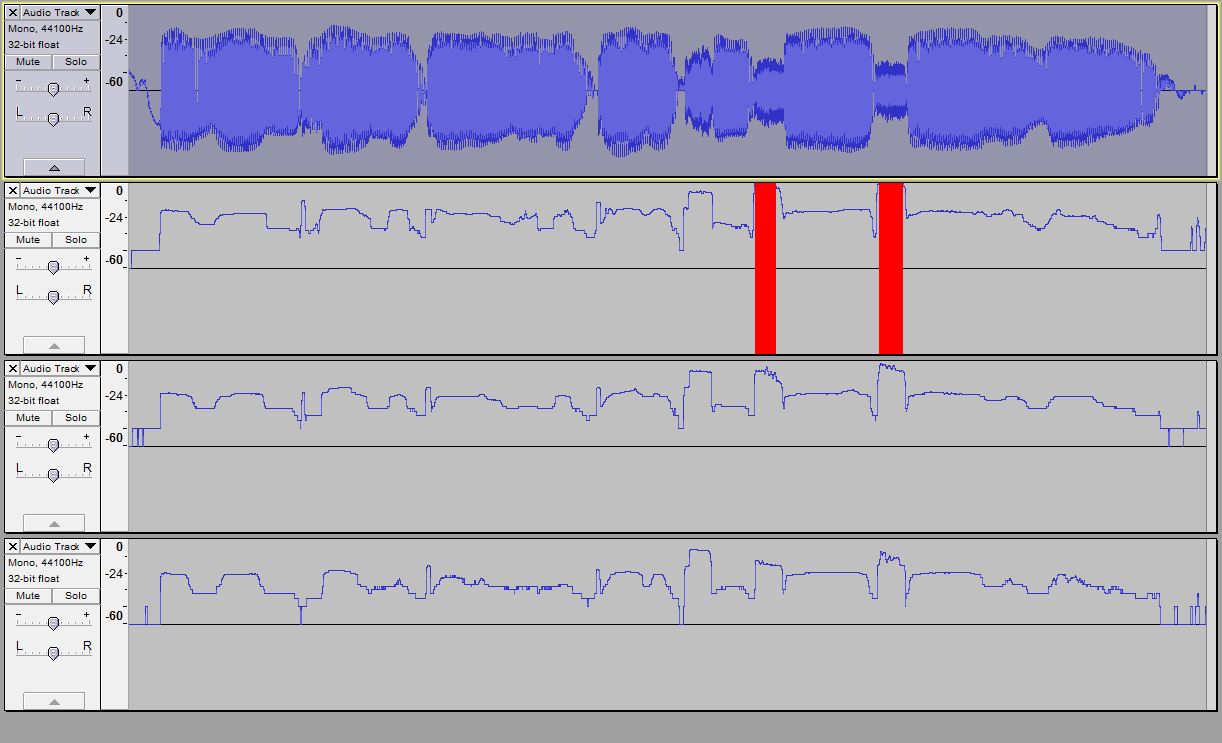
The same but with fft window size of 1024 instead of 256. Much smoothing out of noise in the graphs.
Notice not so much the levels as the steep areas. Now I’m thinking a program that finds those steepnesses and labels the areas between them could do a pretty good job of segmentation of speech.
I also made the graph scales logarithmic this time by selecting Waveform dB view.
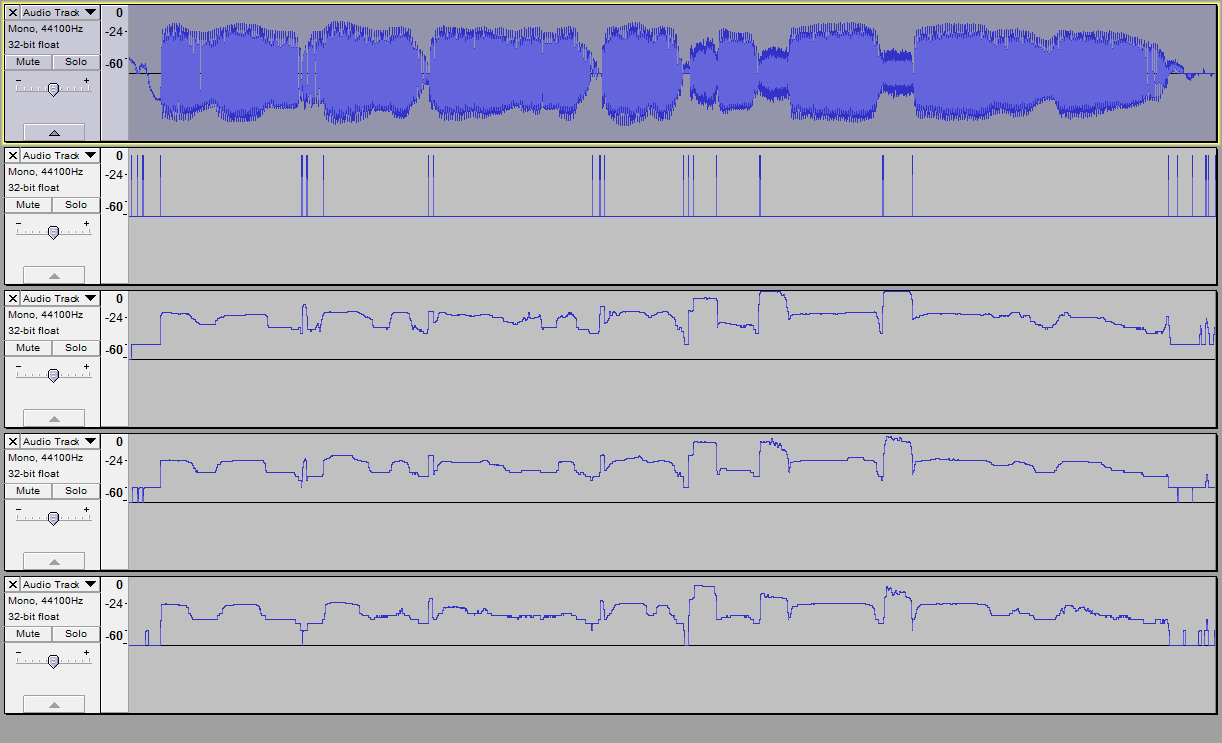
… and I couldn’t sleep until I tried that out! New code, new picture with a new second track which is the result of the new defaults on the same sound. New processing is done in Nyquist-y ways avoiding new inner loops in Lisp. Need to consider how to eliminate my old inner loops in lisp.
It’s after 1 AM in my time zone. Good night! MakeGraph.ny (4.71 KB)
More improvements. Used more Nyquist functions to avoid doing much math in Lisp. I can now segment some selections of my audiobooks in about 0.5 seconds calculation per second of audio, about a tenfold improvement over the previous.
Improving the quality of the results I get is another matter for experimentation.
Update: I fixed the error in the starting point of the graph. Needed to shift it right by a half-window.
Update again: more fixes, including (1) removal of excess data from the right end of the graph, (2) Fixed dialog comments for skip, (3) Better dialog explanation of the last parameter (and changed its units to octaves/sec), MakeGraph.ny (4.51 KB)