Hello I am fairly new with audacity and I am using it basically to just determine the min-max frequency range of an entire track. I know you can determine it in the plot spectrum, but I still don’t understand it fully so if someone can explain it to me in layman’s term it would be much appreciated. This is for a thesis and I really just need to know the min-max frequency range of a song, thank you in advance.
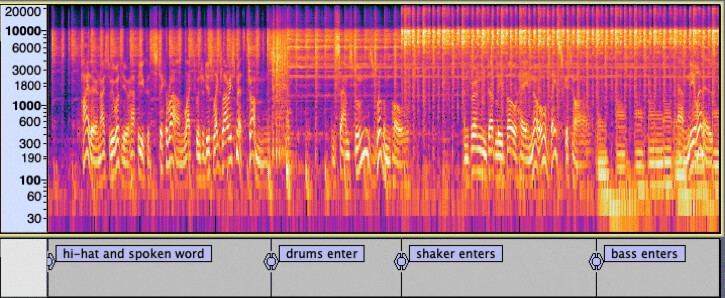
so the 30 is the minimum frequency and the 20000 is the max frequency range of that track if I am not mistaken?
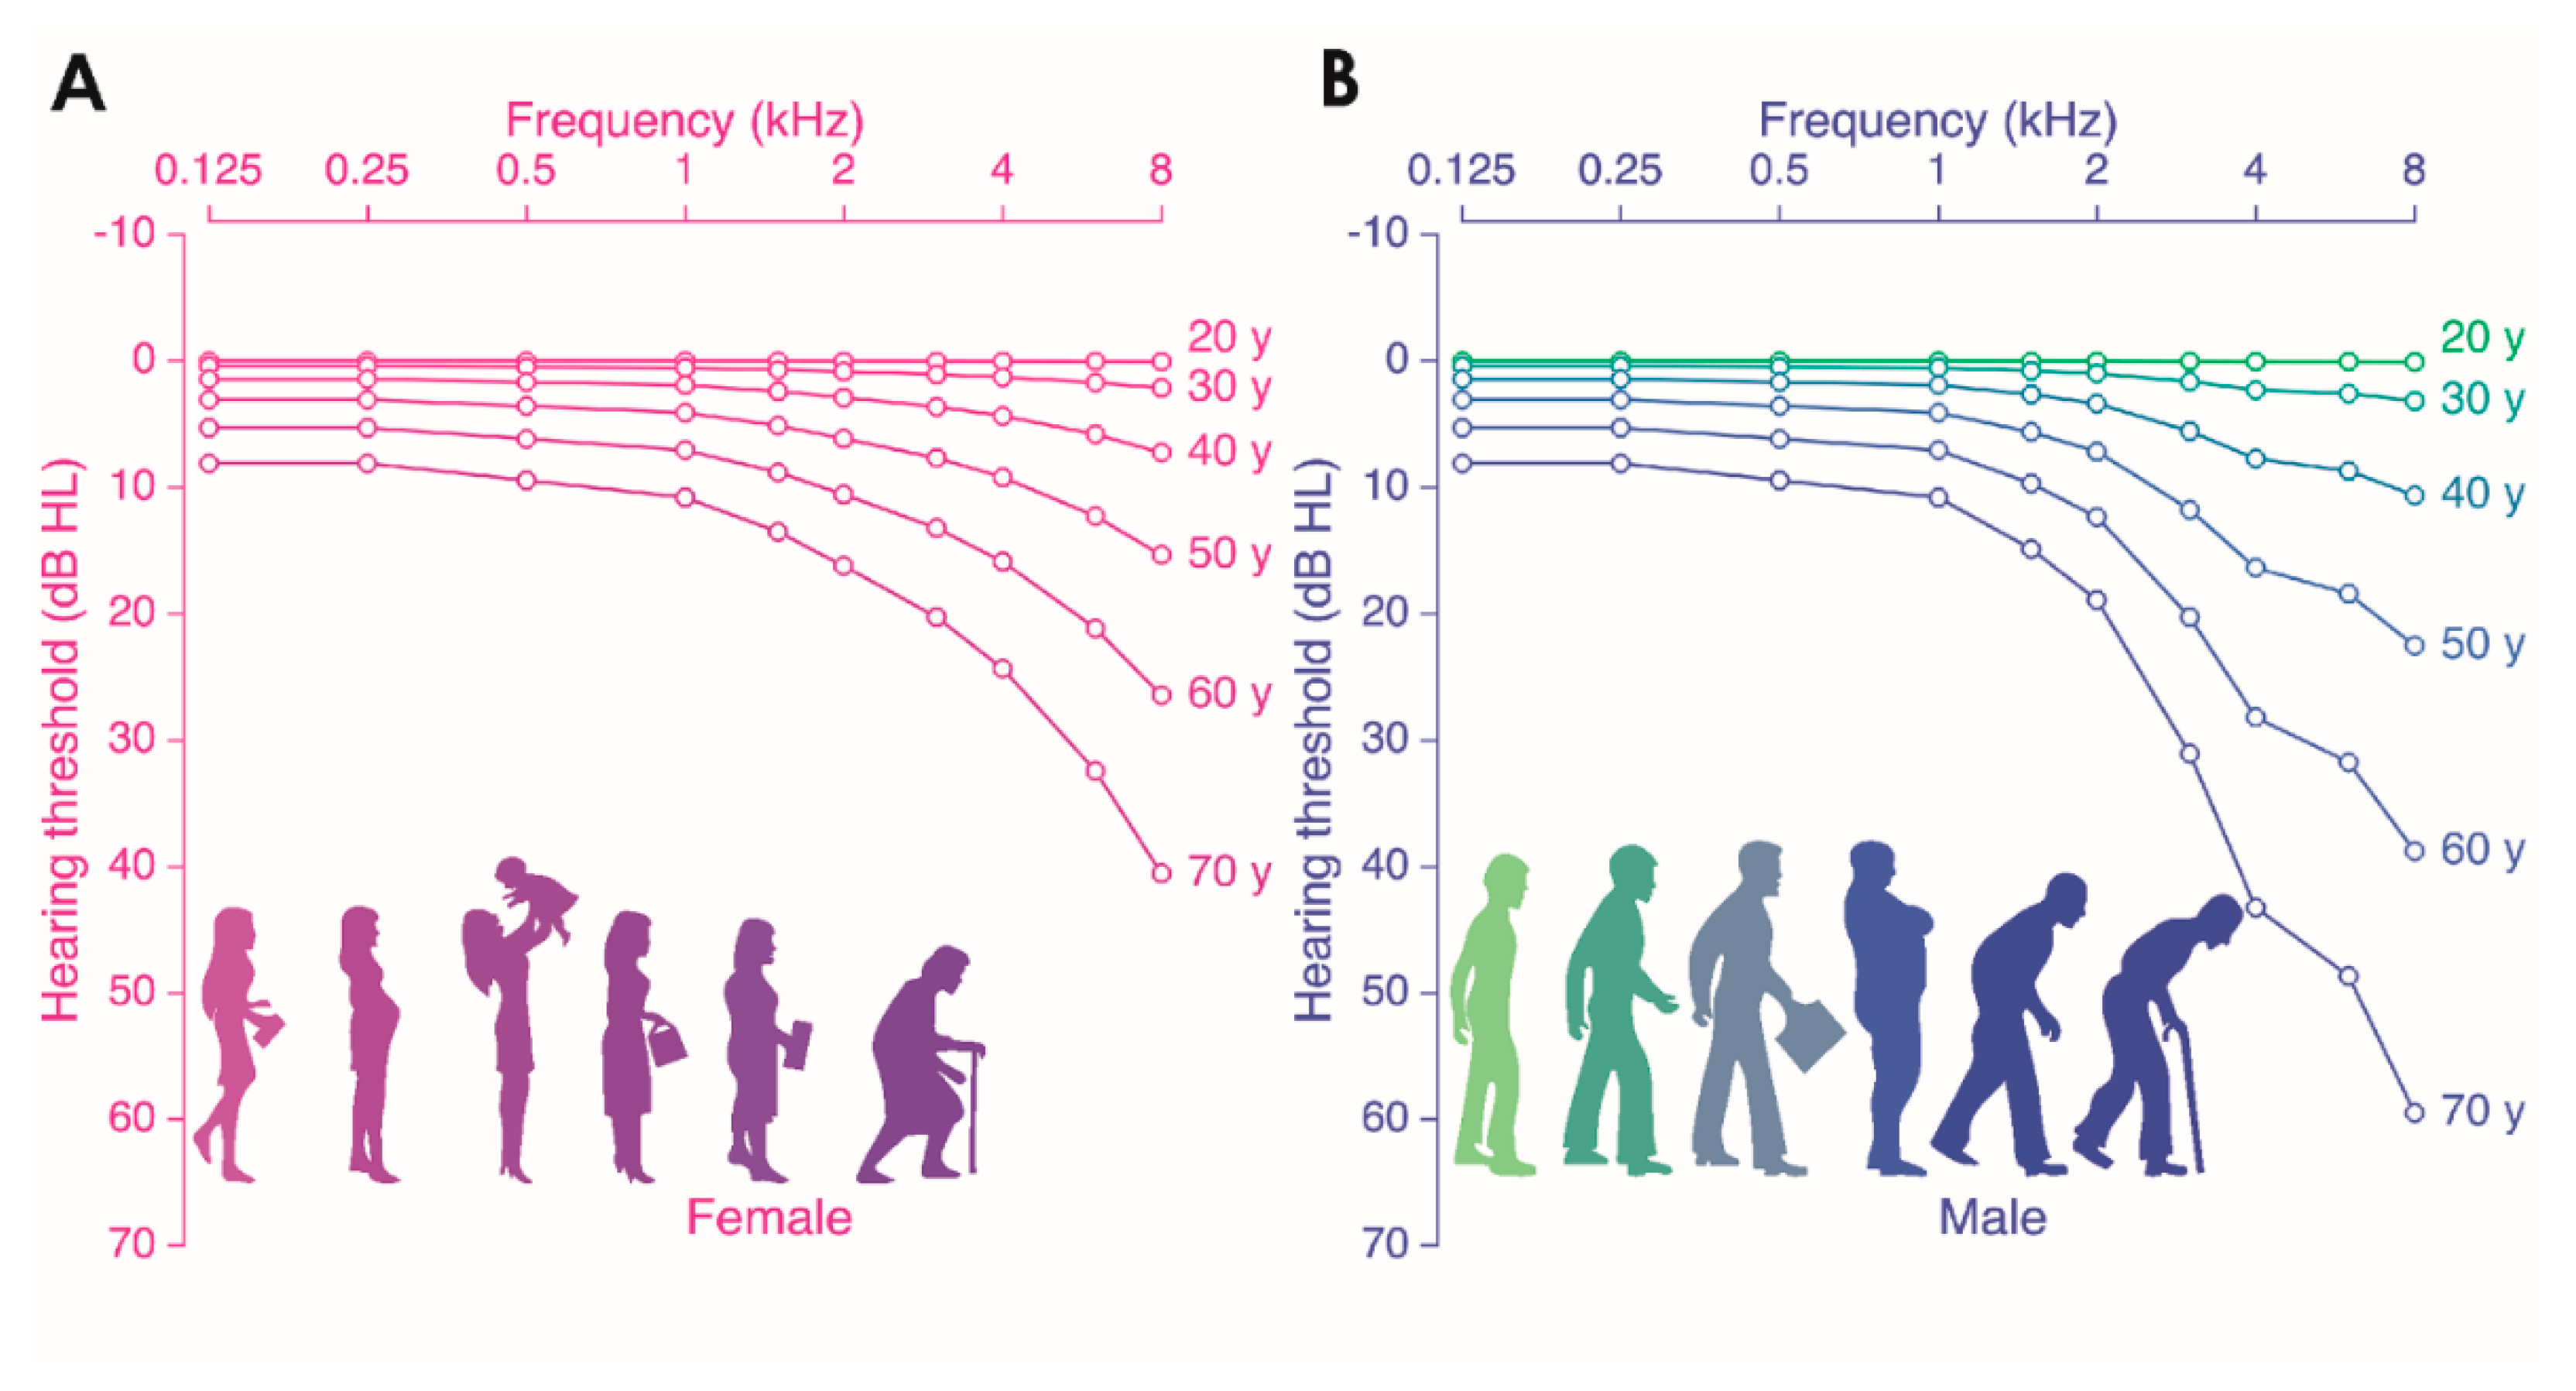
The nominal range for human hearing is 20Hz to 20,000Hz.
High fidelity recordings will typically include that entire range.
(High-frequency limit declines with age: middle-aged people ~14000Hz max )
Yes I understand that, but what I wish to know if the spectogram view with the custom settings will give me at least an approximate measurement of what is the frequency range of a track.
Edit: also is the bold values such as the, 100, 1000, 10000, indicates the actual frequency range of that specific track?
For digital audio, the frequency range is bounded within the range 0 Hz (DC) to half the sample rate. So if the sample rate is 44.1 kHz, then the upper bound is 22050 Hz.
On playback, the lower limit is determined by the playback system (0Hz cannot be reproduced). The upper bound may also be limited by the playback system, though good quality audio equipment can usually go up to 20kHz or a little higher.
Unless the audio is absolute silence, there will be some amount of noise across the entire frequency range, even if the actual music has a smaller range.
The frequency range of the “sound” that heard may be limited further by the listener’s hearing. For most adults the upper limit is around 16kHz or less.
I see so, I just need to know the sample rate of a track and then determine its half and that will be the upper bound frequency rate of a track? But for lower limit, it may be hard to determine?
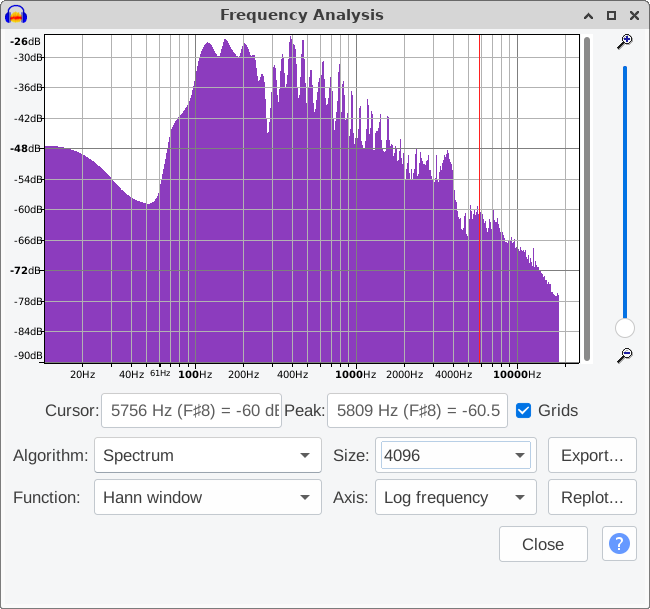
I kinda understand it now, should I base on 100hz as the minimum frequency range of a track or is it base on the graph where I would look where the first peak of the minimum frequency as well as the maximum frequency?
Unless you are working with artificially generated tones, determining the lower limit is a matter of choosing a cut-off level. In the spectrum plot above, you could decide that the lower limit is 60 or 70 Hz. There is certainly some content there, but it is a matter of opinion whether that sound is actually “music” or just background “rumbling”.
1 Like
I see, so it depends on basically where the music of the track actually starts?
It depends largely on how you define “frequency range of a song”.
As an example :
The lowest string on a violin is usually tuned to 196 Hz (G), so for a solo violin you could say that the lower limit is 196 Hz (or whatever the lowest note played is). However, if you cut off all frequencies below 196 Hz, the music will sound a bit “thin” due to lower frequency resonances being removed.
If you measure (scientifically) the frequencies produced by a violin when played, you will find that frequencies in the single figures (below 10 Hz) are present, but usually at inaudible levels.
1 Like
I get it now, thanks both of you for the help and answers!
This topic was automatically closed after 30 days. New replies are no longer allowed.