Hello - I am totally new. I’m a scientist who collects at a lot of data. For some time, I’ve thought it would be interesting to convert some of these data (time series, look like wiggly curves) into musical tones to “play” the data.
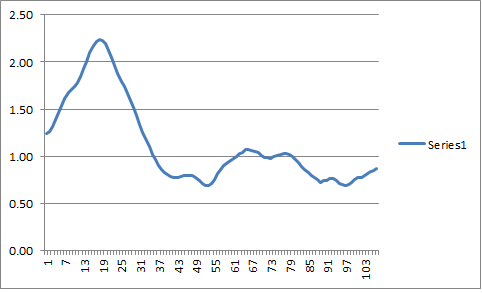
A tip online suggested to try Audacity, since it can import raw text files. However, there must be lots more to it than that. As an example, I’ve tried to convert one data set, consisting of 107 observations, into tones by calculating the mean of the data (4.85), setting that equal to 440 Hz (the tone A, yes?), and then converting the rest of the data to ratios of that (see attached image, a graph of the data).
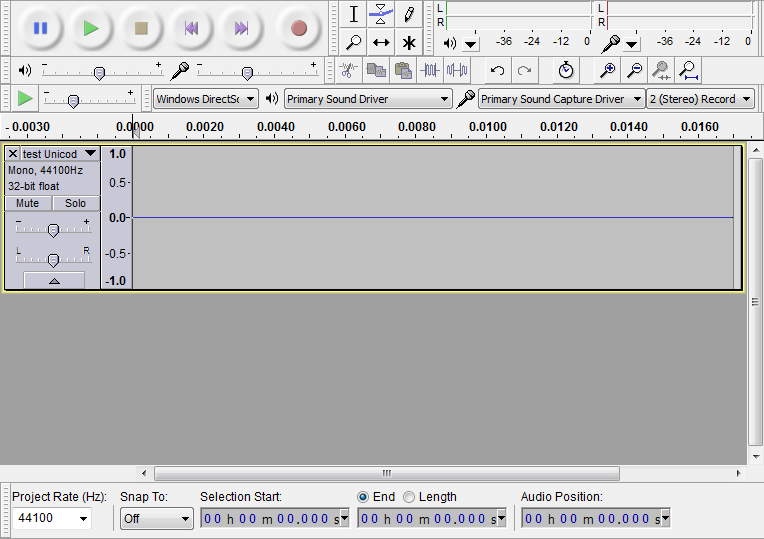
No matter what settings I choose for importing the raw data file, what shows up is a data set that looks pretty much like the next image (filename = window000), and when I play it, it sounds buzzy.
Ideally, for each of the 107 data observations, I would like to play a note that has a duration of about 1/8 to 1/4 second, so I can hear it, and that the value of 1 would be equivalent to the musical note A (for this example).
Any help is much appreciated, thanks!