Hello Folks,
Windows 10/Audacity 2.3.0
A question for someone familiar with Audacity and the function meanspec from the R package ‘seewave’. Disclaimer: I am relatively new to sound analysis, so please don’t assume any knowledge on my part.
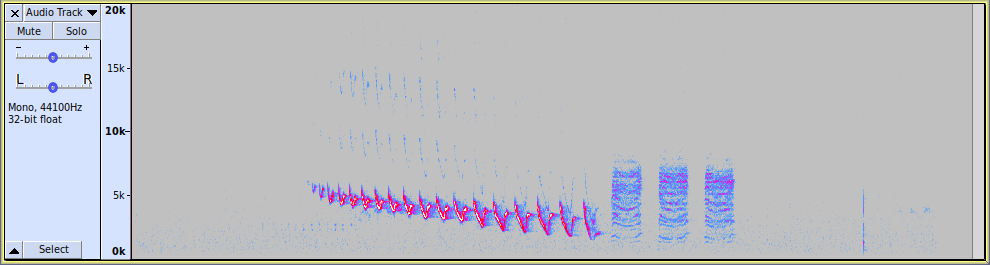
I have two recordings of the same bird call event, from two different songmeter SM3s that were 75m apart - i.e. a bird called, and the call was picked up simultaneously on two different machines. I have clipped a 0.8 s section of the original file from each machine, and these are attached as clip_1 and clip_2
. The call has two syllables, and the clips capture both syllables.
When I use the ‘plot spectrum’ function in Audacity on the entire 0.8 s section I get values for peak amplitude /approximate background amplitude for the call frequency of -60.6/-76.4 dB for clip_1 and -59.1/-76.3 dB for clip_2. My interpretation of these values is that the bird was approximately equidistant from each recorder. I understand that there are other variables affecting the strength of the signal received by the machine, but for my purposes this assumption is reasonable. If I repeat this for a section of the clip containing just the first syllable of the call, the values are -52.0/-77.6 dB and -50.1/-76.3 dB for clip_1 and clip_2 respectively. Again, the values are similar enough that I could reasonably make the same conclusion about the bird being almost equidistant from each recorder.
I can repeat this analysis using the ‘meanspec’ function from the R package ‘seewave’, which produces a similar output to plot spectrum - a list of frequency bins and their associated mean amplitude for the period selected. The code to do this is:
tmp1 ← meanspec(readWave(clip_1), dB = “A”) ## code for the entire clip
tmp1 ← meanspec(readWave(file, from = 0.28, to = 0.37, units = “seconds”), dB = “A”) ## same code clipped for first syllable
Using this method for the entire clip, the values I get for peak amplitude / approximate background amplitude for the call frequency are -37.7/-48.3 dB for clip_1 and -36.5/-48.4 dB for clip_2. This raises my first question - why are the values different to those calculated by ‘plot spectrum’? The relativity of amplitude calculations confuses me, and I suspect that explains the differences here. Overall though, I could reach the same conclusion - peak amplitude values are similar, background amplitude is similar, calls were almost equidistant from the recorder.
However, when using this method for the first syllable only, things go a little crazy. The values I get for peak amplitude / average background amplitude for call frequency are -17.7/-42.3 dB for clip_1 and -23.7/-50.9 dB for clip_2.
Why are these peak amplitude values so different, and why are the background amplitude values so different? The absolute differences are similar, but still more different than for any of the other techniques. It seems to me that Audacity’s ‘plot spectrum’ has a consistency (especially in approximate background amplitude) that the meanspec calculations don’t have. Why is this? Perhaps I am comparing apples and oranges - are meanspec and plot spectrum even the same thing?
Ultimately I want to model distance from the recorder using the peak amplitude of the call but, for several reasons I am restricted to doing this with the data I have on my field recorders, explaining why I am investing in this admittedly agricultural method. It seems to me that doing this using the values from plot spectrum would be OK, but I feel I should also be able to do it using values extracted using meanspec, although the answers I’m getting using meanspec suggest I can’t. Can anyone recognise the problem I’m having and explain why I’m seeing the differences I am?
Thanks in advance.
Nick