I have an audio file from an old BBC Micro computer cassette.
The data in the audio file is split into tracks and each track into a number of blocks with a carrier tone in between.
However, in some places the audio is dirty and I want to know how to fix it.
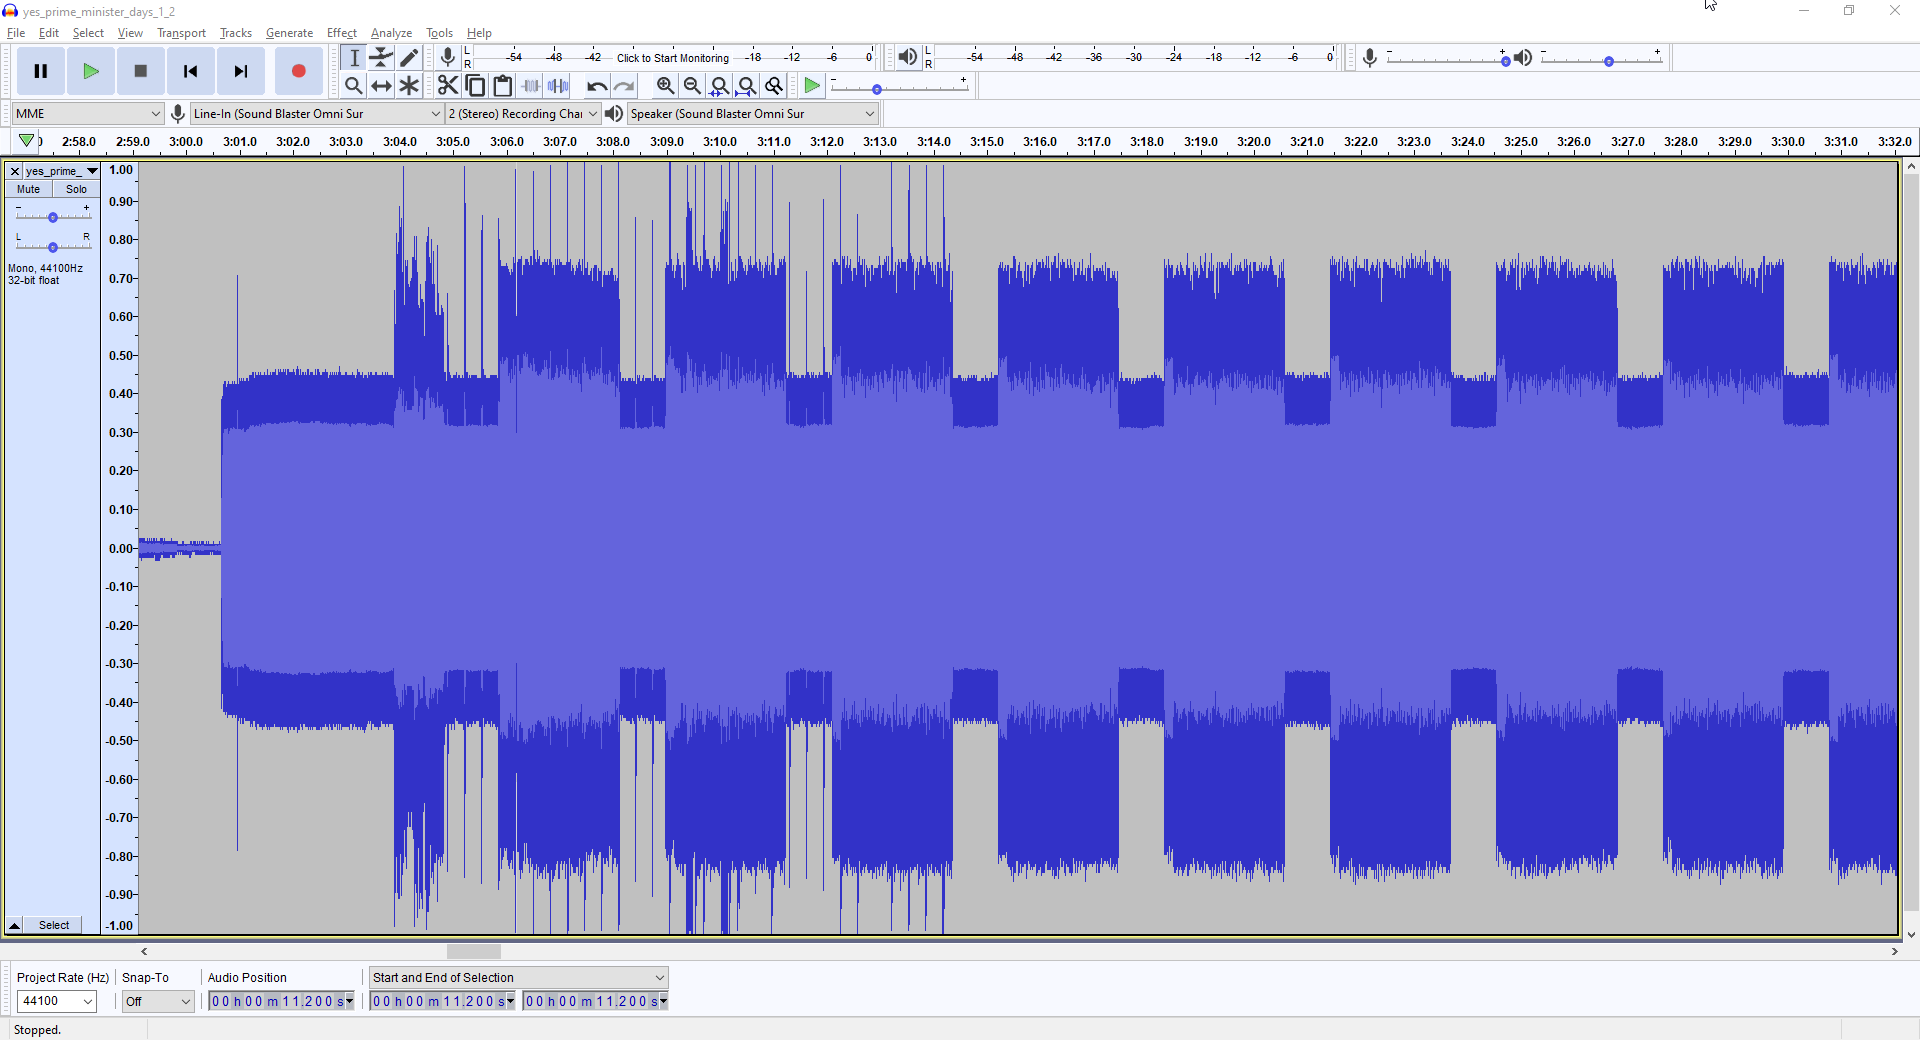
As you can see from the screenshot, the first 4 blocks in this section are very spikey - I assume the frequency modulation is OK in these sections and it’s the spikiness that is causing the issues. So, is it possible to reshape the wave to retain the frequency modulation whilst removing the spiky nature of the amplitude?
Thank you for your help - it’s really important that I find some fix for this because these cassettes are getting rarer and we’re trying to preserve them.
I don’t think that is “audio”. It appears to be “data”.
If I recall correctly, the BBC micro could store data on floppy disk or cassette tape. These “recordings” appear to be such data.
I think you would need a working BBC micro to be able to decode the data.
A limiter, (with no make-up gain), will knock back the spikes,
but I suspect that could corrupt the data, (assuming the spikes are not already corruption).
Thanks for the reply Steve - yes, it is data - Frequency Shift Key’d apparently. However, I’m treating it as audio because it’s analogue and needs to be demodulated through software into binary but, the software fails on the corrupted blocks. The only way I can think of fixing it is using Audacity to somehow repair the damage but I don’t know how. I’ve tried applying notch filters and high and low pass filters but they completely destroy the rest of the waveform. I could try to do this just on the areas of damage but, for some older cassettes, this would be most of the file. The frustration is that I can see the data in the waveform (one 1200Hz cycle is a binary 0 and one 2400Hz cycle is a binary 1) but I can’t get the demodulator to read it.
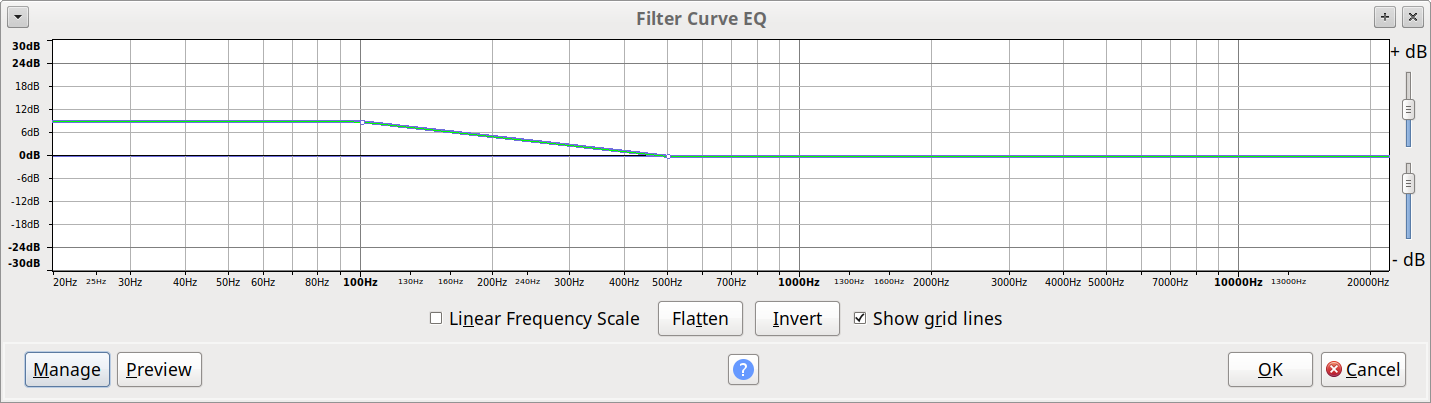
You could try filtering out frequencies below 300 Hz using the “Filter Curve EQ” effect with settings like this (No guarantee it will help, but there does appear to be “noise” at around 200 Hz that should probably not be present):
Old thread I know, but it is the latest I could find that relates to filter curves. I am trying to add microphone calibration to a recording and I am having trouble with the filter curve format. I think it relates to the filter length and maybe some other formatting. The curve I am trying to convert has 4000 points and the level values has a lot of decimals. Is there a guide somewhere for making custom filter curves?
Ah ok. It is a complete curve from 20 to 20k, but somehow when I import it only loads up until around 1000 Hz. Definitely progress, but it is the top end that needs the most equalization. I don’t see any breaks in the pattern in the file, so that is why I was wondering if I hit some upper limit of data points.
I don’t know. The first curve was indexed linearly and had 4000 points. It stopped around 1000 Hz, so I figured that around 200 points would be fine to reach the full range. The next curve was around 150-200 points and indexed logarithmic. It looks fine and will probably work just as well.