Can I determine the percentage of volume increase?

Hi,

Before I get into the details of my query I should point out that I know nothing about audio, so please do be gentle in your replies, what may seem as common knowledge understanding could well be lost on myself. :slight_smile:

So, I’m wanting to analyse a piece of audio and see how much the volume increases from the beginning to the end.

Specifically, I’m looking at an old version of Space Invaders, the marching “dum, dum, dum, dum” sound etc, as the Space Invaders descend the screen the volume increases. I am able to record the volume from the game using Audacity, that much I’ve worked out.

I have zoomed in and can see all the plotted dot, and if I change the view from waveform to waveform db the track gets a measure on the left, presumably in db (not entirely sure what that is to be honest). I don’t seem to be able to select a dot and then see any specific details relating to it.

I have a sample that I will be using in the game I’m developing and I want to apply the percent increases to the audio clip so that it mirrors the effect, I could just “guess” and keep tweaking until its about right, but I was hoping using this tool there may be ways to determine what this looks like.

Any thoughts/help/suggestions would be really appreciated.

Kind regards,

Rob
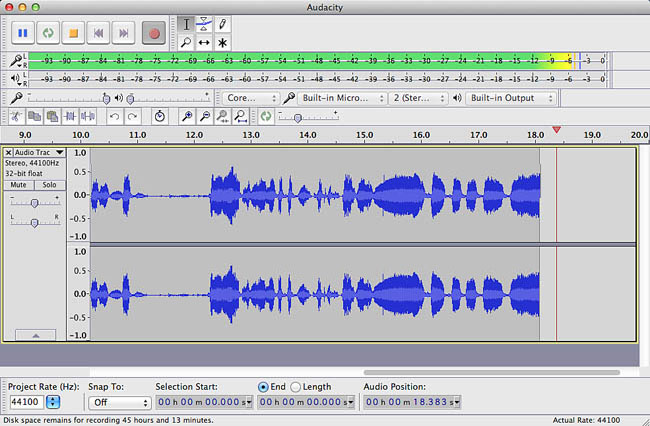
Sound doesn’t fit very well in percent.

See that streak of green left to right? That’s a sound meter from “dead quiet” on the left to maximum loudness on the right. This is a freeze-frame. That meter is normally bouncing to the sound.

0 represents 100%.

-6 is 50%.

This is where you say, “Wait, if that’s 50%, what are all the rest of those numbers?” It just doesn’t work. That’s why we use dB or decibels (from Alexander Graham Bell).

Without getting any further into the weeds, I would probably open the sounds up in Audacity and compare the blue waves on the timeline.

Bigger is louder. That’s a good approximation. It’s not perfect because you can have kinds of sound be different. A violin playing a note and a baby screaming on a jet the exact same note are very different.

That get you close enough?

Koz

If your show goes out of range of the blue waves, you can use the sound meter and guess at the approximate values. “Peaking at about -20dB” for example.

Natural sound doesn’t lend itself to precise measurements.

You may also notice that my meters don’t match the default meters. Meter size can be changed by grabbing with the mouse and pulling and the range is changed in a preference.

Audacity > Edit > Preferences > Interface > Display > Range.

Koz

Forgot the obvious one. Listen to it. Make sure you have at least one sound system similar to your audience and see if it sounds OK on that.

This can be a New User problem when someone is trying to create Great Theater on a laptop—by itself. Sooner or later you have to actually experience the work for real. “Taste the pudding.”

Sometimes good sealed headphones can get you most of the way home in the absence of a good, large sound system.

This problem can crop up in some odd places. There is at least one television network with show sound that has musical notes in earthquake territory.

“I wasn’t ready for the wine glass to start moving. Ummm… Let’s play that again.”

I would not be shocked if games do this.

Koz

Decibels can be confusing… But, it’s the normal way of talking about audio levels…

IMO - It’s best to leave the default display where 1.0 (plus or minus) is 100%.

The easiest way to check the peak dB level is with the Amplify effect. Audacity has already pre-scanned your file and Amplify will default to whatever gain is needed to hit 0dB (100%). For example, if Amplify defaults to +3dB, your current peaks are -3dB. You can cancel the effect if you just want to check (without actually amplifying). That will work a selected portion of the file, or for the whole file if you select the whole file.

Amplify allows you to enter an amplification amount, or you can enter your desired new peak level if you wanted to “match” another file.

However… Peak levels don’t correspond well with perceived loudness. The best approach is usually to it by ear unless you have hundreds or thousands of files and by-ear is not practical.

There is an [u]optional plug-in[/u] intended for audiobook production that can give you RMS levels (a kind of average) as well as peak levels and some other information. It’s a handy thing to have. RMS dB levels better correlate with loudness. There are 3rd-party plug-ins for measuring LUFS loudness (also in dB) which takes-into account that fact that our ears are most-sensitive to mid-frequencies than very-high or very-low frequencies.

I have zoomed in and can see all the plotted dot, and if I change the view from waveform to waveform db the track gets a measure on the left, presumably in db (not entirely sure what that is to be honest).

The “problem is” that the dB view changes the waveform display, not the just the zero to +/-1 “numbers” on the scale. So for example, a sine wave no longer looks like a sine wave. Personally, I don’t like that… I wouldn’t mind if the waveform stayed the same and decibels were shown on the left.

I wouldn’t mind if the waveform stayed the same and decibels were shown on the left.

Like Cool Edit does it.

You’re still only seeing the loudest 24dB of the show, but the numbers translate better.

Koz

Hi all,

Thank you all for the replies, but I will confess to that going pretty much all over my head… :frowning:

It might be that I didn’t explain what I’m trying to do very well, apologies if so.

In the Space Invaders game there is a marching sound effect which starts off at a specific level, as the invaders move down the screen this volume gets progressively louder.

I recorded the audio using Audacity whilst this happens and I can see that the wave form is larger towards the end of the recording, and smaller at the beginning, and there are two other “steps” in the middle where it increases.

When it comes to changing the audio in the game, I can increase a floating point value, so, lets say the volume starts at 1, I could change it to 1.5f, this would be half as loud again, from my (inexperienced) perspective, a 50% rise in volume.

What I was hoping to do was to use Audacity to establish “how much” loud the volume gets during the recorded track, and then map that to the volume control I can set in the game. So, for example, it might be that the volume is twice as loud at the end, so if it starts at 1, and ends at 2 I could reasonably assume the two steps in the middle were perhaps 1.33 and 1.66.

What I’m not sure how to do is establish what that increase actually is in Audacity. I can scroll the track to the left and make the highest dots on the wave form align with the numbers on the left of the track but that might give me a figure thats a bit like -28 (that’s a guess because I can’t zoom in far enough nor can I select the dot in the wave form to see any more detail info).

Assuming I could estimate these dB values this way, how do values like -28, -32, -38 etc all compare to each other? I saw the post above with the 0 = 100% and -6 = 50% etc, so is there some kind of formula that can be used to establish this?

I fully appreciate my lack of understanding/knowledge is the problem here, I just assumed that determining the difference in volume levels of a piece of audio would be fairly straight forward. If I thought it would help I could separate the bits of the track where the volume has increases so that they could be compared to each other, but again I’m not sure if there’s a tool/feature in Audacity for that?

The formula is 20 log (v-out / v-in). V-in is the starting sound and V-out is the end. So 2 volts going in and 3 volts going out. 1.5 … Log … 0.176 … x20 …

= 3.52dB.

So that’s what, 150% louder? 150% of 2 volts is 3 volts.

There is a real-world problem with this process. 3.5dB is a barely perceptible change in volume if you listen to it. You would think 150% volume increase would be enough to crack glass and scare the cat.

I can make it worse. The difference between background sound and human voice in an audiobook is 100,000%. (60dB).

Koz

There is a way to get there. Drag-select a bunch of sound and Analyze > Contrast > Measure Selection. That will be the RMS (loudness) of that selection, based on 0 being maximum. Say -25dB.

Measure another chunk of sound and that might be -20dB. There’s 5dB between them. You can listen to them and get a feel for what that sounds like.

There is no measuring one single sample point in a waveform to get loudness. Loudness is a dynamic measurement over time.

Koz

I can scroll the track to the left and make the highest dots on the wave form align with the numbers on the left of the track but that might give me a figure thats a bit like -28 (that’s a guess because I can’t zoom in far enough nor can I select the dot in the wave form to see any more detail info).

We’ve given you a few ways to accurately measure dB levels.

it’s easy to match peak dB levels because the Amplify effect allows you to type-in the new peak level. (You can’t enter an amplification percentage or amplification factor or ratio.)

But, I warned you that the peak dB level (or wave height or percentage) may not correlate well with perceived loudness.

Assuming I could estimate these dB values this way, how do values like -28, -32, -38 etc all compare to each other? I saw the post above with the 0 = 100% and -6 = 50% etc, so is there some kind of formula that can be used to establish this?

I have a little spreadsheet with the formulas but sometimes I’ll use a calculator.

dB = 20 x Log(A/Aref) The same formula that Koz gave you where A is amplitude (a number in a digital audio file, or voltage, etc.)
or dB = 20 x Log(percentage)
In Excel =20*LOG(percentage(/100)) or =20*LOG(A/Aref) Of course you can enter the variables directly or point to cells.

Ratio = 10 to the power of (dB/20)
Percentage = 100 x 10 to the power of (dB/20)

In Excel Ratio = POWER(10,(dB/20)) or Percentage = 100*POWER(10,(dB/20))

Hi,

Thanks again for the replies.

So I’ve used the Contract Analyser as suggested (thank you) on the recording of the invaders launching to landing. It’s quite difficult to tell from the wave form where the significant increases are, but I think I’ve found a few. I then select 4 of the chunks from the wave form (by chunks I mean, a singe “dum” in the “dum dum dum dum” pattern etc, so hard to explain via text!) and have got the following results;

1: -35.31
2: -32.29
3: -30.74
4: -29.24
5: -27.28
6: -26.38
7: -23.63

I would imagine, as an old 8-bit game, there is probably another “chunk” in there somewhere, as 7 levels would seem odd, I’d expect 8 levels of volume, this is probably me just missing one of the increases.

I was about to give the formulas a go that you’ve both provided (thanks again) but realised I have no idea what the V-in / V-out stuff is or where I’ve find that? Sorry if I am being problematic, not my intention.

Looking at the playback levels indicator at the top of Audacity, the first marker is placed around -10, after some time (about 20 seconds in on the attached .ogg file - the .wav was too large to attach (6.6mb)) it starts to increase (or perhaps that should say decrease) from -10 to about -8, then -6 then -4 - it doesn’t ever reach 0 so guessing its about a -1 at the end.

I believe in an earlier post it was said that going from 0 to -6 would be effectively a 50% change in volume, I’m assuming in a “quieter” direction? As when I played this the values were getting closer to 0 etc.

I have no idea what the V-in / V-out stuff is or where I’ve find that? Sorry if I am being problematic, not my intention.

It’s a ratio, or the percentage/100.

If those are dB levels, they are rather low…

I don’t see how this helps you, but I plugged your numbers into Excel:

-35.31dB = 1.72%
-32.29dB = 2.43%
-30.74dB = 2.90%
-29.24dB = 3.45%
-27.28dB = 4.33%
-26.38dB = 4.80%
-23.63dB = 6.58%

it doesn’t ever reach 0

That’s a good thing. 0dB is the volume that the sound “runs out of numbers” and starts distorting. It can’t get any louder even if the physical performance tries. It’s sometimes called clipping because the waveforms look like the tops and bottoms have been surgically clipped off.

It’s not a gentle error. The system stops following the show and starts making up new sounds; crunchy, crackling and popping and it’s usually permanent.


When you open something in Audacity, it converts the work to a format that doesn’t overload (32-bit Floating). This lets you experiment with different effects, filters or corrections without permanent distortion or damage. The Audiobook Mastering Suite, for one example, sometimes creates overload and triggers warnings in the middle of the correction but then fixes it before export.

Koz

I get that its a percentage etc, I just don’t understand where I get the two values from to use in the calculation?

Those were the values reported via the contrast analyser, one thing I was wondering, does it take into account any of the “white space” between the “chunks” in the wave? If it does, and then averages it out, perhaps that’s why those values are low?

Thanks for putting those into your spreadsheet, out of interest, would the 0dB be 100%, hence why as the negative number is getting closer to zero the higher the percentage?

So, in my scenario, in the game the audio is getting louder, e.g. its getting closer to the 0dB which would indicate its max volume in the game. So whilst I am trying to establish the percentages so that I can tweak the volume in the game, I need to look at it perhaps from the other direction, rather than the volume “starting” at its “normal”, perhaps its just starting quieter and building up to its normal.

In any account there’s still a bit I’ve not got yet which is the difference between the increases, in Doug’s percentages above, as he states, they seem quite low, and if I was to use those percentages against the scale in the game engine I don’t doubt that I wouldn’t be able to hear it.

Out of interest, looking at this snippet from the track, this is one of the “dum” iterations in the marching sound effect. Why is there a negative value both above and below the horizontal line through the middle of the track?

Thanks again and to Doug for the replies and continued help… sorry I’m not grasping this that well…
WaveForm.jpg

You’re getting into the heavy deep theory. When you sing, the actual exhalation of breath doesn’t carry any music. That’s just blowing out a candle. It’s your throat causing lumps and bumps and vibrations in the air flow that’s doing the work. That’s represented by the up and down parts of the waveform. Addition to and subtraction from the plain air flow.

I know people whose positive vibrations are different from the negative. I can tell the difference between one woman announcer and her male partner just from the waveforms. Her waveforms are not symmetrical.

My voice isn’t entirely symmetrical.

It’s inconvenient and usually unnecessary to have two different sound meters for a performance, one for the up parts and one for the down, so the job is usually handled by one meter which either averages out the waveform, picks the taller, or in some bad meters, just ignores one of the two.

So yes, there can be two different dB values depending on which direction you’re measuring. And you can have a third one if you’re watching the bouncing sound meter. And in no case can you stop the world and measure one tiny part of it and derive anything meaningful.

That business of simply watching the sound meter bounce and guessing at an approximate value is looking better and better isn’t it?

Koz

Erk! I didn’t really want to do that…

Would the horizontal line be representing the “air flow” in that analogy? In either case, are both both sides of that line negative though?

Gaaaaaahhhhh! :open_mouth:

I just wanted to know how much the volume was increasing across this clip… this is nuts… there must be an “easy” way to establish this, do normal people never need to know this kind of stuff? Am I asking for something really odd/unusual/random/bizarre? I kinda fee like it. Fully appreciate this is still my lack of understanding but I am really surprised for something like “volume” it isn’t more straight forward. :frowning:

LOL… potentially, if I could make those values mean something yeah… for example, if I could map those values to something useful in the game engine, along the lines of;

-12dB = 1.0f (normal level of audio)
-10dB
-8dB
-6dB = 1.5f (50% more volume)
-4dB
-2dB
-1dB = 2.0f (200% volume)

or, obviously, the reverse, where-by I start playing the audio at a lower level and build up to the “normal” level.

I don’t know how much more there is. We’ve given you the overall rules of sound level change. I already told you about the baby screaming on a jet. That’s the human ear response thing. “Come and fix the baby” takes priority over the violin note.

Design one experiment and listen to it on a representative sound system.

–=|=–

Just because you might run into this:

There is Sound Pressure Level. This is real world standing in front of a brass band. No electronics. This one does go “the right way” starting at 0dBSPL, no audible sound and working up to standing in front of a jet +125dBSPL. A very special version of this shows up in Health and Safety laws.

“Your machine shop shall be no louder”…etc.


Screen Shot 2019-06-29 at 18.18.02.png
There is no easy direct relationship between the dB readings inside an electronic sound system and the volume of a brass band.

Koz

Hey Koz,

Thanks again for taking the time to reply… I feel some what lost in all of the analogies now to be honest… I do appreciate the time everyone has taken to try to help me though.

Your job doesn’t work very well with conventional sound measuring techniques.

Koz