I have been working through the process of recording my record collection. Typically it is 1970’s rock LP’s.
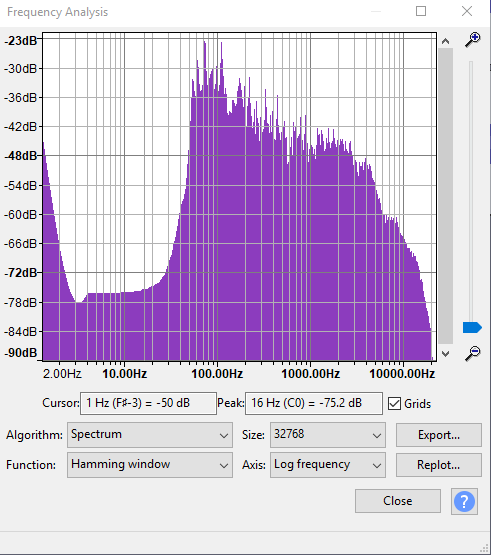
As part of the process I like to create a more balanced frequency response using the Equalization Effect. A typical looking starting Frequency Response might look like this:
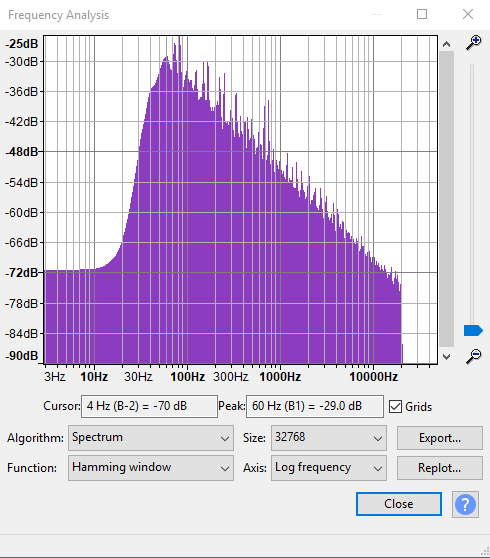
My aim is to get it looking more like this:
To date I have been manually adjusting each track using the Draw setting in Equalization which can be painfully time consuming. But in my opinion improved the sound enough to make it worthwhile.
So my question is whether there is a tool to automate this some way. I see that I can export from the Frequency Analysis. It is like I need a way to import that preferred spectrum file and apply it to individual tracks. This would probably get 90% of the work done and just need some manual fine tuning from there.
Here’s my take on how to use Steve’s “SpectrumToEqCurve.ny” plugin …
Once you have created the equalization curve for your desired EQ
then all you have to do is flatten the equalization of your source audio using an inverted version of its own equalization curve, then apply the equalization curve derived from your desired EQ to the flattened version.
Thank you! I think I understand the workflow you are suggesting but I don’t seem to be able to generate a curve file that will work.
I have opened my Desired EQ file (or track Y in your terms). I ran Plot Spectrum, set the size to 128 and exported the text file which I named Master EQ.
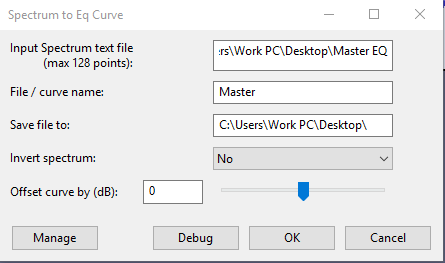
I then opened Spectrum to EQ Curve and completed the form as per below and generated an XML file called Master.
To test this file I opened a new track and opened Equalization and imported the Master curve file. But the EQ curve did not visually change and whilst the Equalization process ran, nothing changed. I did save a random curve manually and that imported fine. So it seems I am doing something wrong when running the Spectrum to EQ Curve.
Exporting the frequency-analysis from “plot spectrum” generates a text file, (the file name ends in “.txt”).
Must use the full file name, (including “.txt”), in the “Spectrum to EQ Curve” plugin, see …
If successful that plugin generates an XML file, (not a txt file), which you can import into the equalizer.
If the number of points is too large, then strange and undesirable things will happen.
Consider if your “template” file has sine tones at 1000 Hz and 1010 Hz, and the “target” file has a sine tone at 1005 Hz. With an extremely large number of points, the Eq curve will have multiple points between 1000 Hz and 1010 Hz, so rather than the target file’s 1005 Hz tone being brought up to the level of the tones in the template, it will be pushed down to the noise floor level. With a smaller number of points, the Eq curve is effectively smoother, so the target will follow the template more accurately (but less precisely).
In practice, I find that 64 to 128 points works well. This is equivalent to using a 64 or 128 band Graphic Eq.
With 128 points the frequency range only goes down to 750Hz (at 96,000Hz project rate it seems?). I would like to achieve a curve that will adjust to say 40Hz. It could reduce the top end range. Is there a setting or simple way to change the low and high points of the spectrum per point count? Or in this case is it just set from 0 to 48,000Hz and at 128 points the math is the math?
I’d recommend using 44.1 kHz sampling rate. With 256 points, the lowest point will then be 86 Hz.
If you use 512 points with 44.1 kHz sample rate, then you get the lowest frequency point at 43 Hz, but note that at higher frequencies, the points become very close together and you will get significant spikes in the Eq curve unless you do something to smooth the curve. Trebor suggested a neat way to smooth the curve in Audacity. Alternatively, you could modify the spectrum.txt data in a spreadsheet or text editor.