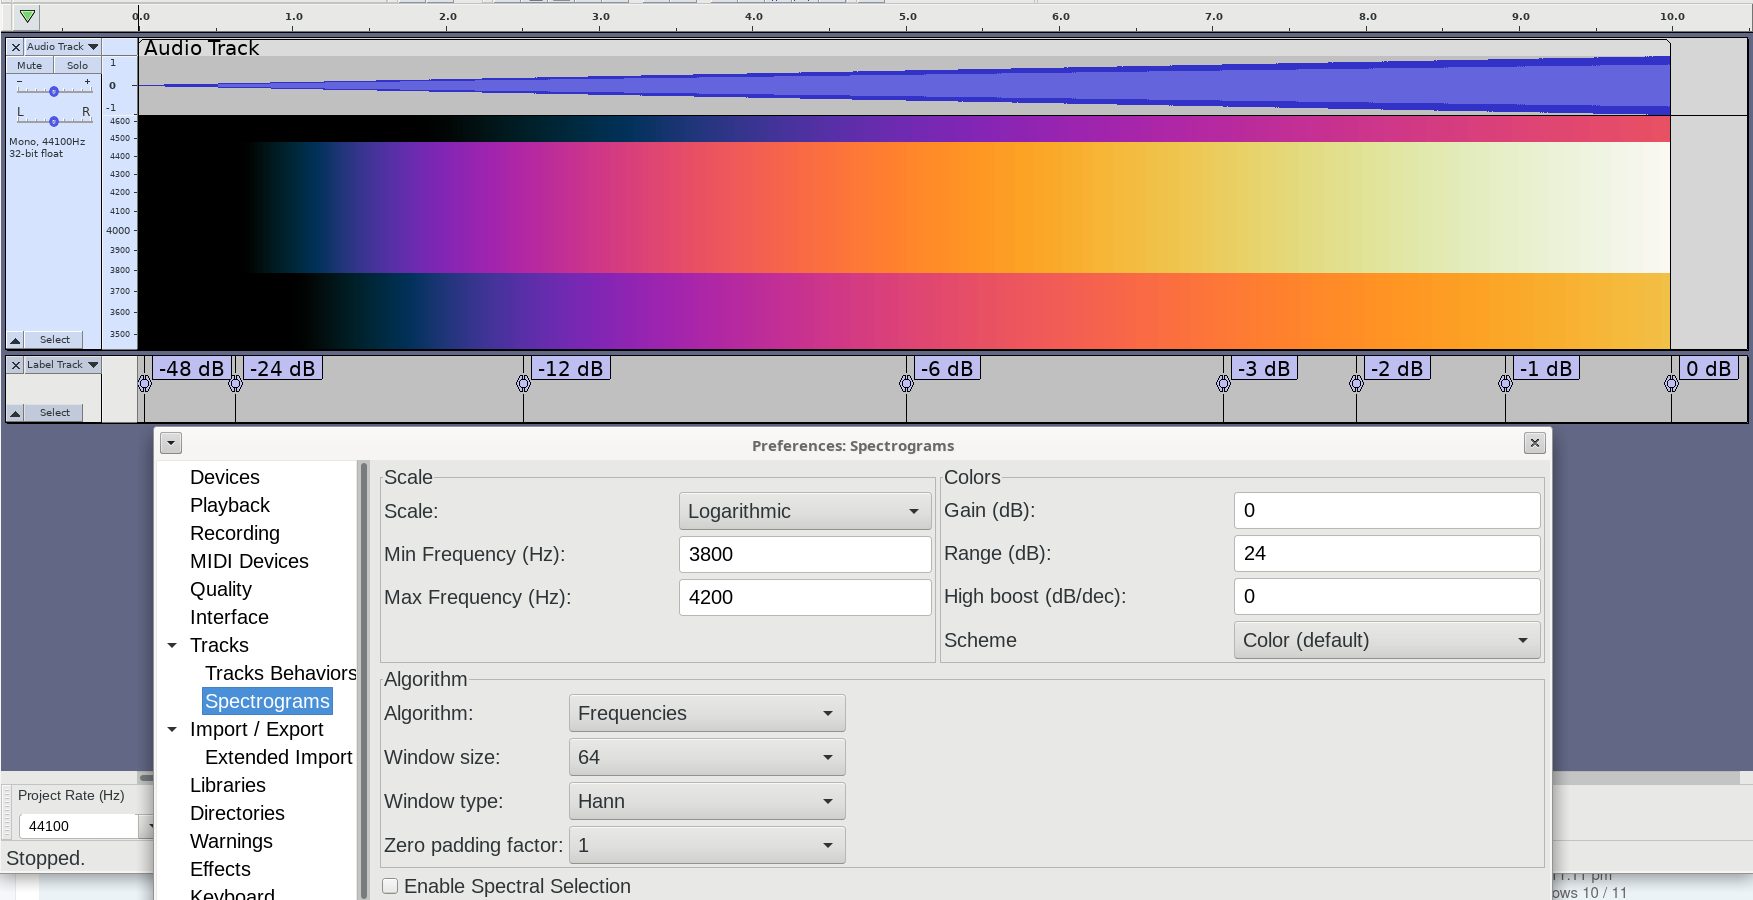
Hello, I am trying to understand how the spectragrams are calculated in Audacity. If I knew which library folder to look in, with the source code, it might help. I want to replicate the same graph with Python to prove to myself that I understand the plots and where they come from.
Normally dB is calculated as follows:
dB = 20 log_10 (a1/a2), where a1 is the signal and a2 is some reference signal.
For example, the threshold of human hearing at 1 kHz, is 0 dB sound pressure level (spl), is relative to reference sound pressure 20 microPascals.
I don’t understand your question but with digital, the reference is the “digital maximum” of 0dBFS = zero decibels full scale. That’s as high as you can count with 16 or 24 bits etc., or 0dBFS is 1.0 in floating-point. 16-bit WAV files can hold numbers between −32,768 and +32,767, and if your positive & negative peaks hit those numbers your peaks are hitting 0dB. And of course silence is a series of zero.
So digital dB levels are always negative except for floating-point where for all practical purposes there is no maximum (or minimum). Audacity uses floating-point internally.
DSP is normally done in floating point and you’ll probably want to do the same in Python.
When you record or play (or open in Audacity) everything is automatically scaled so a 24-bit file isn’t “louder” than an 8-bit file.
There is no calibration between dBFS and dB SPL but there is a correlation (if you don’t touch the volume control, etc.) i.e. A 10dB drop in the digital level makes a 10dB drop in SPL.
I am trying to understand how the spectragrams are calculated in Audacity.
Is there a real-world goal or job? Sometimes someone will post a dry, theoretical question when they really wanted was enough info to do a recording job.
Also, do you really want the spectrogram code? I think staring at the colored bands is nice, but for real sound analysis, Analyze > Plot Spectrum can give you a lot more detailed information.