Bioacoustics - Minimum Frequency and Frequency Bandwidth

Hi there,

I am using Audacity for bioacoustics research. I am looking at various measures of bird song and am interested in obtaining both the fundamental frequency and frequency bandwidth of songs. I understand the Plot Spectrum analysis feature but this encompasses the whole clip whereas I would like to isolate individual songs.

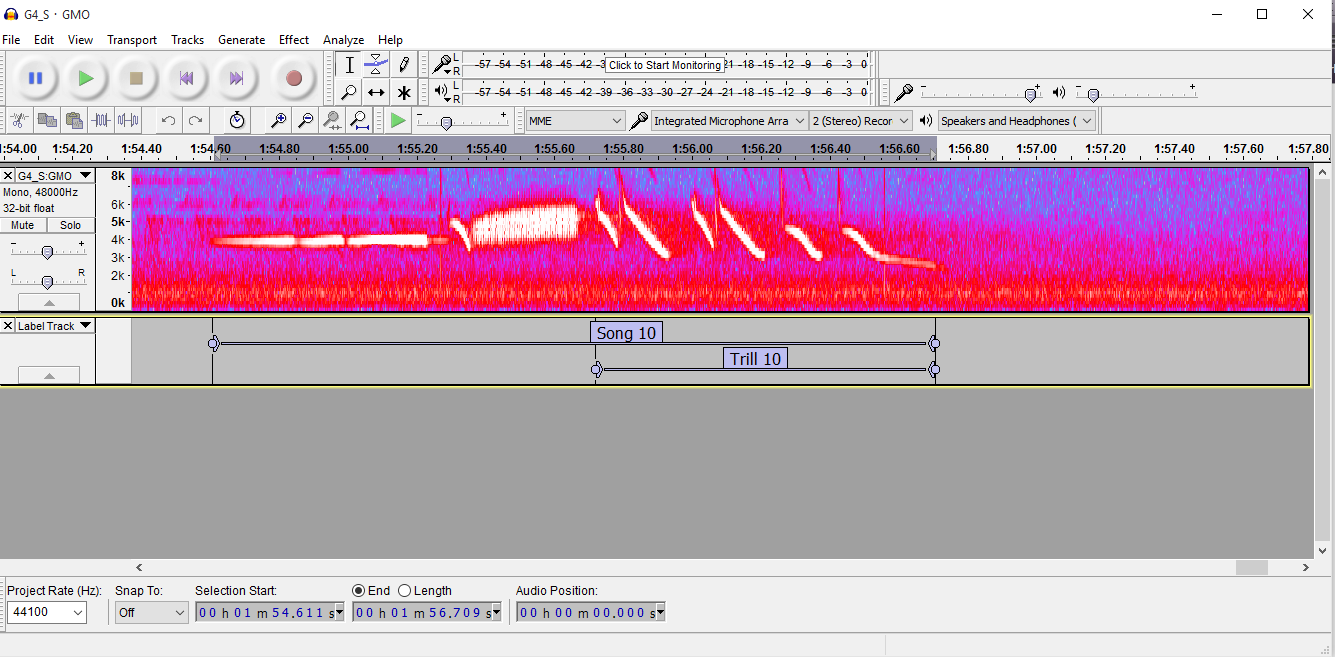
For example, the image below is a sonogram of the bird song I am looking at. I am able to analyze temporal aspects of the song through labeling, but not the frequencies. Does anyone have any suggestions on how to do this?


Windows 10; Audacity 2.1.0; I believe I obtained the .exe installer.
SongExample.png

Assuming that you are using the current 2.1.1 version of Audacity (available here: http://web.audacityteam.org/download/windows)…

If you enable the “Spectral Selection Toolbar” and set it to show high and low frequency bounds (http://manual.audacityteam.org/o/man/spectral_selection_toolbar.html)
then you will be able to read the upper and lower frequency bounds of a “Spectral Selection” (http://manual.audacityteam.org/o/man/spectral_selection.html).
There is currently no way in Audacity to make “vertical” labels, but you could use this code in the Nyquist Prompt effect (http://manual.audacityteam.org/o/man/nyquist_prompt.html) to create a label that has the upper and lower frequency bounds displayed in the label text:

;type analyze
(list (list 0 (get-duration 1)
            (format nil "~a Hz / ~a Hz"
                    (round (get '*selection*  'low-hz))
                    (round (get '*selection*  'high-hz)))))

Also, labels may be exported as a text file using "File > Export Labels… " (http://manual.audacityteam.org/o/man/file_menu.html#export_labels)

Thank you so much! This is exactly what I needed.