Hello… I am using Audacity 2.1.2 on Windows 7. This is a fabulous software package by the way. Do you know what is the anti-alias filter setting being used in the sampling or re-sampling. In the more recent digital seismic recorders it is often something like 0.8 Nyquist rate… so recordings using 500 samples per second are reliable up to about 200 Hz rather than 250 Hz, for example. (to avoid hi-amp hi-frequencies wrapping around to the low end of the spectrum). Thank you!
That’s a very old version, but if I recall correctly, it has the same resampling code as is used now.
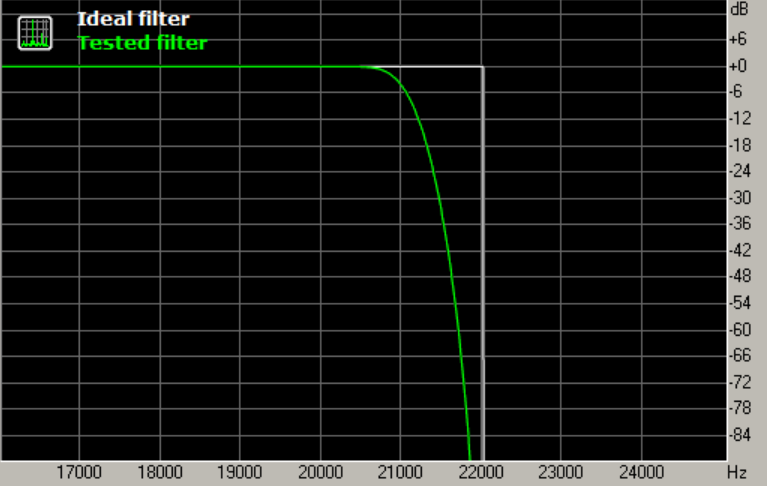
Audacity has extremely high quality anti-aliasing filtering, using the soxr resampling library.
This image show the cut-off when resampling from 96 kHz to 44.1 kHz.
I don’t know the specifics, but it’s “good enough” for audio. That is, you shouldn’t get any audible aliasing. For scientific use, you may have some different requirements.
Do you actually need to downsample or record at low sample rates?
There is a [u]Low Pass Filter Effect[/u] that you could apply before downsampling. You’d get that filtering in addition the built-in anti-aliasing filter.
When recording, the anti-aliasing filter is built-into the hardware because the signal has to be filtered before sampling/digitizing. Of course if you downsample, it has to built-into the downsampling algorithm.
it is often something like 0.8 Nyquist rate
A filter has two basic parameters - The cutoff frequency which is defined as the -3dB point (no matter the type or sharpness of the filter) and the slope (i.e. 12dB per octave, etc.) which defines the sharpness of the filter. (There are also filter “types” which define how it behaves near the cutoff frequency.
There are no perfect filters but in software you can make a more-ideal filter simply be adding “more code” and if you’re not filtering in real-time there is “no cost” to a more complex filter.
Unlikely that you will get significantly better anti-alias filtering in any hardware or software. The soxr library is exceptionally good. The main limiting factor for Audacity is that it is “only” 32-bit float, so the noise floor is “only” about 5000 times lower than CD quality.
Thanks very much for the plot etc. I just hadn’t found any info on anti-alias filtering in Audacity, but I guess it was probably a bit of a dumb question.
Well, I use the software for re-mastering my old live band stereo recordings and this is really why I have evaluated the software as “fabulous”… it allows me to do a lot of “fixing” of things that ruin an otherwise great recording (for the musicians involved, that only hear their “flubs”!)… and also the basic re-EQ work and a couple of small overdubs here and there.
The reason I talked about using the 500 sample rate is because I could not find another way to shorten the frequency range of the spectral “analysis” plot to show only the low freq. end, where I have been perusing (and discussing) the large very low freq. air pulses from Industrial Wind Turbines (IWTs). They have a range from about 2 Hz to 50 Hz with dominant freq. between 4 and 16 Hz. (lets say… there are all a little different due to the action of the wind when the blade passes the vertical support) These are the so-called “infrasound” pulses but actually range from the inaudible to the audible range, where you can hear a faint “whump” if you are located about 300 m downwind of an “edge” turbine from a cluster of turbines.(you might have to move around a bit… the wavelength is about 100 ft… there is a lot of cancellation from the cluster or “source array” filter but also a lot of leakage and constructive interference in places… hopefully not at your house! ) The peak is about 10 to 20 times higher amp. than the part of the “noise” you can sometimes hear (thus the real problem). The pulses are quite easy to record with any good audio mic which you can then EQ to the mic specs using the “linear” option in Audacity which ranges down to 0 Hz. (mic specs are in dB power (SPL) so you have to divide the value in half for the EQ compensation in dB amp.) I should not really get too far into the details of recording the pulses and the “source array” effects etc. here I think. Anyway, there has been some confusion in the industry and a lot of concentration on the “blade pass interval/frequency” which is usually around 1 HZ (plus or minus). However, this is merely the “pulse firing rate” and should not be considered as part of the spectrum of the pulse. Of course if you jam 30 minutes of time recording into the FFT you just get a bunch of artifacts that have been misinterpreted as “the spectrum of the IWT noise”.(one guy put 6 hours of data into the FFT as if trying to accumulate some indication of “infrasound” from outer space) There is even a published idea that you can “stack spectra”… which is of course ridiculous. You can only really look at a freq. spectrum of one pulse at a time… or show 3 separate ones and say…“here are some typical spectra of pulses”… then look at 3 more 30 minutes later if that’s what you’re worried about. The industry has been using a method appropriate only for constant-noise “whirring” machines like diesel generators (even so, 10 min. of data is more than enough)… not appropriate for impulsive sources. Why has this been happening?..you may well ask.
Anyway… is there another way of limiting the range of the spectral plot to say, 0 to 100 Hz (so we can really see the details at from 0 to 20 Hz) without re-sampling? It doesn’t really matter that much as the re-sampled plots are good enough… there is no significant noise above about 60 Hz except some of the turbines have a mosquito-like whine around 8600 Hz (Ontario Govt will only allow measurements in the noise spec. from 31.5 to 8000 Hz.) This may all change soon. It’s a bit of a screwed up topic. I’m not actually in the Acoustics field. I am a semi-retired geophysicist, but I know quite a lot about the effects of low-freq. pulses from music recording (not to mention 35 years in the seismic industry) as I spent 8 years in a rock band before going back to school in 1980.
Thanks a lot!
Hi… It looks like I made a “mistake” in my previous post where I suggested you have to divide the microphone “response” SPL specs by 2 to enter the compensation curve in the Equalization effect in order to achieve a flat response on the low freq. end. I saw the plots and other explanations using “amplitude” but it seems that everything is actually operating in power (SPL) because I found the reference in the Help under “Amplify and Normalize” … “whose peak amplitude is -6 dB (+0.5 to -0.5 on the vertical scale)”. … so you can just use the positive values of dB found in the microphone specs for the equalizer curve to get a flat mic response? I guess the labelling as amplitude in the software is just something you have to know about. Do you think that is correct?
Thanks