The Analyze->Plot Spectrum shows a plot with 40Hz as the lowest x-axis value. I would like to plot down to at least 20Hz, and preferably 10Hz (many movie soundtracks have infrasonic content). I don’t see any way to do this. Why is this seemingly arbitrary limitation built in? Can it be enhanced to go lower?
Yes, but not in the way you think. If you present content at 5Hz, Plot spectrum will display spikes at 5Hz. It takes its display characteristics from the content.
This can drive you nuts if you want to compare two different works.
You could use the Change Speed effect which proportionally increases pitch/frequency. (That’s a fairly simple and “clean” effect without almost no side effects).
I generated a 5Hz sinewave tone*. Then increased the speed by 50X (the maximum) then by 2X. The plot shows a nice peak at 500Hz.
You might want to low-pass filter your audio first.
As you may know, FFT (used for plot spectrum) is “imperfect” and there are compromises. A larger FFT size gives you more resolution and (somewhat counterintuitively) you need more frequency-resolution at low frequencies.
\
I’m getting clicks/glitches when I generate subsonic frequencies but you’re’ probably not generating tones, and I’m still usable results.
A better way would be to “resample” down to a low sample rate, but that’s probably not necessary.
The spectral analysis uses something called a “Fast Fourier Transform” (FFT: Fast Fourier transform - Wikipedia)
This is a way to split a signal into a large number of frequency bands. The “Size” parameter in Plot Spectrum determines the number of bands.
The number of frequency bands is half of “Size”. The frequency bands are evenly divided between 0 Hz and the Nyquist frequency (half the sample rate).
So, for example, if the sample rate is 44100, then the Nyquist frequency is 22050. If “Size” = 65536, then the audio is split into 32768 frequency bands at intervals of 0.672913 Hz
22050/32768=0.672913
Short answer, for better low frequency resolution, increase the “Size”, and / or decrease the sample rate.
See: Plot Spectrum - Audacity Manual
I generally use one of the two highest sizes available. I’m doing this exercise to get the maximum detail and information I can. Sloppy, blobby lumps need not apply. It is also noted that I can stretch the display wider and wider to get even more detail.
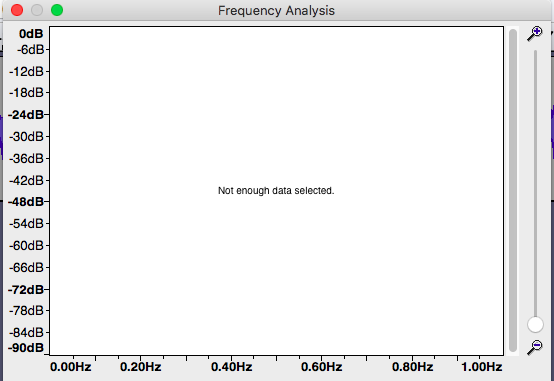
This has limits. If I am intent on analyzing really low pitch tones, I have to get enough of the tone in my drag-selection for the analysis to work. If I fail, it will say so.
Sorry to waste everyone’s time. I pulled a total bonehead by not noticing the Size setting. Thanks so much for jumping in with so much help. This is a great forum.