Plot spectrum for noobs

I’ve watched a few YT videos about using both the spectral analysis (Plot Spectrum…) and spectrogram tools.

The vast majority seem to say ‘stick with the defaults’ (either. because they don’t know how to use the other parameters in the Plot Spectrum view, or they just want to simplify the video to demonstrate the basic function – which is fine.

My question is, what am I looking at, when I’m reading the exported text file from the ‘Plot Spectrum’ window? – it seems to be an outline of the peaks & troughs and their decibel levels. Is doesn’t seem to be every whole number value for frequency (in the 1st column).
Is this correct? And then I can use this data to find the (likely) noise component expressed numerically, and that would guide my equalization profile?

Plot Spectrum uses a mathematical algorithm called “Fast Fourier Transformation” (“FFT”).
In simple terms, FFT splits the signal into multiple frequency bins. It then measures the amount of sound that lands in each bin.

The “Size” parameter determines the length of audio that is analyzed at a time, and the number of “bins”. For example, for a size of 512, FFT analyzes the sound in chunks of 512 samples (this is also called the “window size”), and splits the sound into “size / 2” = 256 frequency bins.

For a sample rate of 44100 Hz, the total frequency bandwidth is 22050 Hz. That is, the range of possible frequencies that can be represented by a sample rate of 44100 Hz is from 0 Hz (DC) to 22050 Hz (the Nyquist frequency).

So for a window size of 512, and a sample rate of 44100, the available frequency range (22050 Hz) is divided into 256 bins, each with a width of
22050 / 256 = 86.1328125 Hz.

Here is an example of the first part of an exported file where the window size was set to 512. Observe that the frequencies are multiples of 86.1328125

Frequency (Hz)	Level (dB)
86.132812	-68.890556
172.265625	-61.266174
258.398438	-49.719128
344.531250	-20.277422
430.664062	-12.834599
516.796875	-17.457932
602.929688	-45.636292
689.062500	-58.301544
775.195312	-66.412956
861.328125	-72.453300

I’m not sure that’s the best use of the tools.

You use the equalizer effect to adjust your performance to be its best. You can use Plot Spectrum to identify sound distribution, pitches, and noise relationships and where, for example, you need to put soundproofing in your studio.

Spectrum peaks at 60Hz, 180Hz, 360Hz are typical of wall power problems in the US. That can be desk lamp buzz or a bad microphone cable. It is possible to help that damage in post production filtering, but it’s far better to fix the desk lamp or microphone.

Another common problem is massive spectrum display to the left of 100Hz. That’s typical of affordable home USB microphones and that “rumble/earthquake” noise can compromise your show’s effects, filtering, and sound matching.


I don’t use Spectrum defaults. They don’t show me enough. The default Size is 1024 which is “OK,” but tends to display sloppy, general ideas where musical tones live.

I pull the display wider. The detail goes up when I do that.

This is the “Nebula Presentation” theme sound at default 1024.

Screen Shot 2021-03-13 at 9.10.43 AM.png
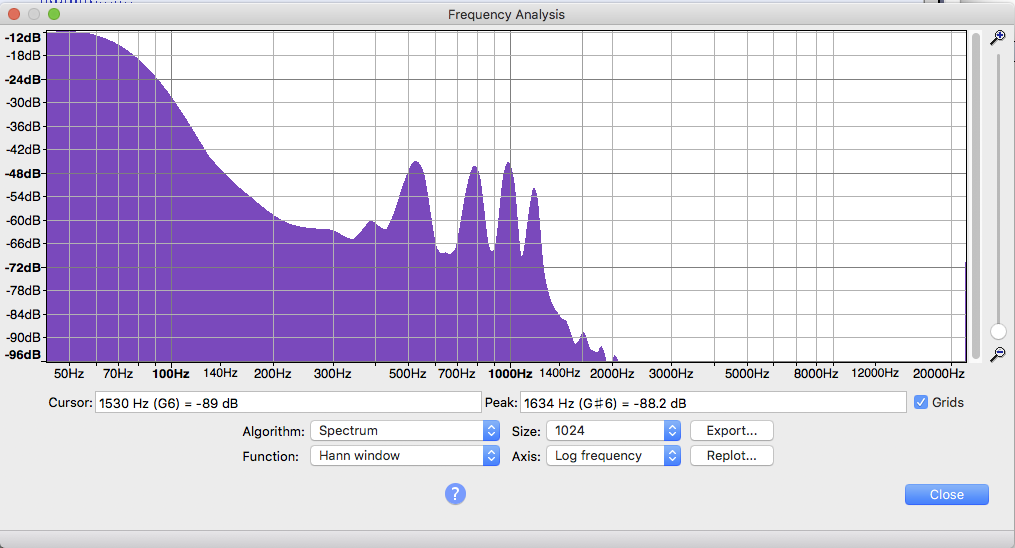
That’s OK. But there’s no detail there.

This is the same theme song with the Size cranked up to 32768

Screen Shot 2021-03-13 at 9.11.34 AM.png
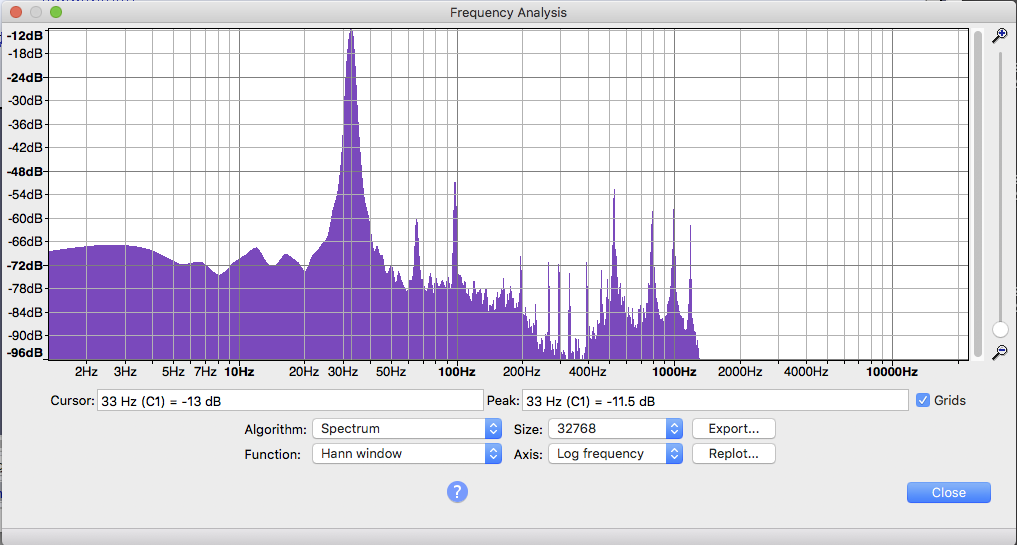
That massive blue blob on the left has resolved itself to a single musical tone at 33Hz. That works out to be the 16 foot pipes on a large church organ and pedal C1 (over on the left).

Lots more information. That’s why I don’t use the defaults.

That can also tell you Action Items. If you wanted to get rid of that tone, Effect > Equalization may not be the best tool. You can force that to work, but I would use a sloppy notch filter at 33Hz.

Koz

That’s helpful, thanks. 1024 what? pixels? (Told ya’ I was a noob)

What I’m trying to do basically is clean up LP digitizations, and remove noise and rumble.
For instance, what you see here is the 1st few seconds of the LP of the [famous] Van Cliburn performance of the Tchaikovsky first piano concerto, old RCA Victor LP. That pattern that looks roughly like a piano keyboard (funny coincidence) shows up pretty consistently in all my digitizations from my Sony turntable and Kenwood receiver and Behringer UM2.
From what I can see, it looks like pretty distinctive shelf there, right about 30 Hz and below. So you’re saying a notch filter would be better than an equalization curve? But if I’m doing another piece later that has low strings like the Strauss Also Sprach Zarathustra, or beginning of Stravinksy Firebird, that might be around that neighborhood, and I’d hate to cut it out.

I’m trying to come up with just the right way of removing my distinctive (?) pattern of turntable rumble.


But for higher pitches, my hearing isn’t as reliable, as I have some loss (though I do wear a digital hearing aid). So what I’m looking for is a way to graphically ‘assist’ me in telling the difference between high frequency noise and desirable overtones.

See my post here: Plot spectrum for noobs - #2 by steve

(I do realize that another thing that will affect the turntable rumble is whether the vinyl record itself is at all warped to whatever degree)

So hypothetically if I could paste the text into a csv file, it ought to render 256 rows? Not that I need to do that, since there’s already a graph right there, duh. I just wanted to know if I was understanding you.

Use the “Export” feature and open the exported file in a text editor. You will see 255 rows of data between (excluding) 0 Hz to 22050 Hz (assuming the sample rate is 44100 Hz).

Ah, excluding 0, of course. Thanks! (Just too lazy to count the rows, since I don’t have my text editor in line-numbering mode, if it even does that.)